

All Classes Namespaces Files Functions Variables Typedefs Enumerations Enumerator Properties Friends Defines
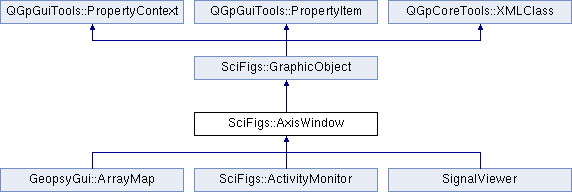
The QbtAxisWindow widget provides an XY graphic with two axis. More...
#include <AxisWindow.h>
Public Slots | |
| void | browse (QRect &r) |
| void | checkZoomRects () |
| virtual void | deepUpdate () |
| void | setMapScale (double rx1, double ry1, double rx2, double ry2) |
| virtual void | update () |
| void | updateExternalGeometry () |
| virtual void | updateGeometry () |
| void | updateInternalGeometry () |
| void | zoomIn (double rx1, double ry1, double rx2, double ry2) |
| void | zoomOut () |
Public Member Functions | |
| virtual void | addProperties (PropertyProxy *pp) |
| void | alignHScales (AxisWindow *ref, double atReal) |
| void | alignVScales (AxisWindow *ref, double atReal) |
| AxisWindow (QWidget *parent=0, Qt::WFlags f=0) | |
| GraphContent * | graphContent () const |
| bool | isZoomed () const |
| virtual void | polish () |
| virtual void | print (QPainter &p, double dotpercm, int x0Sheet, int y0Sheet, bool mask) |
| virtual void | removeProperties (PropertyProxy *pp) |
| virtual void | restoreScaleFonts (int *tmp) |
| virtual int * | scaleFonts (double factor) |
| void | setHorizontalLine (int l) |
| void | setVerticalLine (int l) |
| void | swapAxes () |
| void | updateScrollBars () |
| Axis * | xAxis () const |
| virtual void | xml_polish (XML_POLISH_ARGS) |
| virtual const QString & | xml_tagName () const |
| Axis * | yAxis () const |
| ~AxisWindow () | |
Static Public Attributes | |
| static const QString | xmlAxisWindowTag = "AxisWindow" |
Protected Member Functions | |
| virtual XMLMember | xml_member (XML_MEMBER_ARGS) |
| virtual void | xml_writeChildren (XML_WRITECHILDREN_ARGS) const |
Properties | |
| QString | gridLines |
| QString | printBitmap |
| QString | printLineWeight |
The QbtAxisWindow widget provides an XY graphic with two axis.
QbtAxisWindow has always three children:

The content is a 2D space, X and Y where you can stack several layers. Each layer carry distinct types of data and distinct way of plotting them to the content. The layers all inherits GraphContentLayer. Any new type of layers can be implemented and added to any content. The content stores a QPixmap to avoid long redrawing of huge data layers every time the content need refreshing. To force the redrawing of the content call update().
For basic plotting tasks you generally use only a reduced set of class functions the main ones are:
Here is an example that creates a top level graphic (that appear directly on the desktop like any other windows)
#include "AxisWindow.h"
#include "XYValueLines.h"
#include "ColorPalette.h"
#include "SciFigs.h"

namespace SciFigs {

int main(int argc, char ** argv)
{
  TRACE;
  // Initialization of Qt and SciFigs
  Application a(argc, argv);
  SciFigs s;

  // Creation of graphic object
  AxisWindow * w=new AxisWindow;

  // Creation of a layer containing lines (optimized for high number of items)
  XYValueLines * plot=new XYValueLines(w);

  // Init 65000 lines with 5 points each
  int * pcount=new int[65000];
  for(int i=0;i<65000;i++) pcount[i]=5;
  plot->setPointCount(325000,65000,pcount);

  // Populate the layers with all points
  Point2D * p=plot->points();
  double * values=new double[65000];
  for(int i=0;i<65000;i++) {
    for(int j=0;j<5;j++) {
      p[i*5+j]=Point2D((double)rand()/RAND_MAX,(double)rand()/RAND_MAX);
    }
    values[i]=(double)rand()/RAND_MAX;
  }
  plot->setValues(values);

  // Init the color palette
  ColorPalette pal;
  pal.defaultColors(20);
  pal.setVLinear(0,1);
  plot->setPalette(pal);

  // Change properties of axis
  w->xAxis()->setTitle("Distance X (m)");
  w->xAxis()->setRange(0,1);
  w->yAxis()->setTitle("Distance Y (m)");
  w->yAxis()->setRange(0,1);

  // Show graphic and start event loop
  w->show();
  return a.exec();
}
Here is an example that creates a graphic inside an existing GraphicSheet
  // sheet is assumed to be of type GraphicSheet, graphic is ready for adding new layers
  AxisWindow * w= (AxisWindow *)sheet->addObject("AxisWindow");
  w->setPrintAnchor(sheet->currentOrigin());   // Locate the object at top left corner of the sheet's visible area
  sheet->showObject(w);                        // Insert object in sheet and polish the object
  sheet->autoResizeContent();                  // Make sure that sheet limits are correct
The zoom and the size functions are usually automatically handled, responding to user actions. print() is called on user request or when printing a complete GraphicSheet.
| SciFigs::AxisWindow::AxisWindow | ( | QWidget * | parent = 0, |
| Qt::WFlags | f = 0 |
||
| ) |
Construct a graphic with an empty content
References browse(), checkZoomRects(), deepUpdate(), SciFigs::Axis::East, SciFigs::Axis::North, SciFigs::Axis::setGraphContent(), SciFigs::Axis::setOrientation(), SciFigs::Axis::setOrientationBlocked(), SciFigs::GraphicObject::setPrintHeight(), SciFigs::GraphicObject::setPrintWidth(), SciFigs::Axis::setSizeInfo(), SciFigs::Axis::setTitle(), SciFigs::GraphicObject::sizeChanged(), TRACE, updateExternalGeometry(), zoomIn(), and zoomOut().
                                                  :
    GraphicObject(parent, f)
{
  TRACE;
  _xSBar=new QScrollBar(Qt::Horizontal, this);
  _ySBar=new QScrollBar(Qt::Vertical, this);
  _xSBar->hide(); // because no zoom at the beginning
  _ySBar->hide();

  _xSBar->setMinimum(0);
  _xSBar->setMaximum(0);
  _xSBar->setSingleStep(1);
  _xSBar->setPageStep(10);
  _xSBar->setValue(1);

  _ySBar->setMinimum(0);
  _ySBar->setMaximum(0);
  _ySBar->setSingleStep(1);
  _ySBar->setPageStep(10);
  _ySBar->setValue(1);

  _content=new GraphContent(this);
  _content->setObjectName("content");

  _xAxis=new Axis(this);
  _yAxis=new Axis(this);
  _xAxis->setObjectName( "XAxis" );
  _yAxis->setObjectName( "YAxis" );

  _xAxis->setTitle( "X" );
  _yAxis->setTitle( "Y" );
  _xAxis->setOrientation(Axis::North);
  _yAxis->setOrientation(Axis::East);
  _xAxis->setGraphContent(_content);
  _yAxis->setGraphContent(_content);
  _xAxis->setOrientationBlocked(true);
  _yAxis->setOrientationBlocked(true);

  setPrintWidth(10.0);
  setPrintHeight(10.0);
  _xAxis->setSizeInfo(10.0);
  _yAxis->setSizeInfo(10.0);

  connect(_xAxis, SIGNAL(rangeChanged()), this, SLOT(checkZoomRects()) );
  connect(_yAxis, SIGNAL(rangeChanged()), this, SLOT(checkZoomRects()) );
  connect(_xAxis, SIGNAL(sizeChanged()), this, SLOT(updateExternalGeometry()) );
  connect(_yAxis, SIGNAL(sizeChanged()), this, SLOT(updateExternalGeometry()) );
  connect(_xAxis, SIGNAL(contentChanged()), this, SLOT(deepUpdate()) );
  connect(_yAxis, SIGNAL(contentChanged()), this, SLOT(deepUpdate()) );
  connect(_content, SIGNAL(zoomIn(double, double, double, double)),
          this, SLOT(zoomIn(double, double, double, double)));
  connect(_content, SIGNAL(zoomOut()), this, SLOT(zoomOut()));
  connect(_content, SIGNAL(browse(QRect&)), this, SLOT(browse(QRect&)));
  connect(_content, SIGNAL(mouseMoved( QPoint, Qt::MouseButtons, Qt::KeyboardModifiers) ), _xAxis, SLOT(trackMouse( QPoint) ));
  connect(_content, SIGNAL(mouseMoved( QPoint, Qt::MouseButtons, Qt::KeyboardModifiers) ), _yAxis, SLOT(trackMouse( QPoint) ));
  connect(_content, SIGNAL(mouseInside( bool) ), _xAxis, SLOT(setMouseTrack( bool) ));
  connect(_content, SIGNAL(mouseInside( bool) ), _yAxis, SLOT(setMouseTrack( bool) ));

  // Scroll bars signals
  connect (_xSBar, SIGNAL(valueChanged( int) ), this, SLOT(xScrollChanged( int) ));
  connect (_ySBar, SIGNAL(valueChanged( int) ), this, SLOT(yScrollChanged( int) ));
}
| void SciFigs::AxisWindow::addProperties | ( | PropertyProxy * | pp | ) | [virtual] |
Reimplemented from SciFigs::GraphicObject.
References QGpGuiTools::PropertyProxy::addCategory(), SciFigs::GraphContent::addProperties(), SciFigs::Axis::addProperties(), QGpGuiTools::PropertyProxy::setCurrentCategory(), QGpCoreTools::tr(), TRACE, xAxis(), and yAxis().
{
  TRACE;
  GraphicObject::addProperties(pp);
  if( !pp->setCurrentCategory(_categoryXAxis) ) {
    pp->addCategory(_categoryXAxis, tr("X Axis"), QIcon( ":/images/AxisX.png"));
  }
  xAxis()->addProperties(pp);
  if( !pp->setCurrentCategory(_categoryYAxis) ) {
    pp->addCategory(_categoryYAxis, tr("Y Axis"), QIcon( ":/images/AxisY.png"));
  }
  yAxis()->addProperties(pp);
  _content->addProperties(pp);
}
| void SciFigs::AxisWindow::alignHScales | ( | AxisWindow * | ref, |
| double | at | ||
| ) |
Align horizontal scales of two graphics
References SciFigs::GraphicObject::_printAnchor, SciFigs::GraphContent::options(), SciFigs::GraphicObject::positionChanged(), SciFigs::SciFigsGlobal::screenResolution(), QGpCoreTools::Point2D::setX(), TRACE, QGpCoreTools::Point2D::x(), and SciFigs::GraphContentOptions::xr2s().
{
  TRACE;
  QPoint pRef(ref->_content->options().xr2s(at), 0);
  pRef=ref->_xAxis->mapToGlobal(pRef);
  QPoint pThis(_content->options().xr2s(at), 0);
  pThis=_xAxis->mapToGlobal(pThis);
  _printAnchor.setX(_printAnchor.x() - (double) (pThis.x() - pRef.x())/SciFigsGlobal::screenResolution());
  emit positionChanged();
}
| void SciFigs::AxisWindow::alignVScales | ( | AxisWindow * | ref, |
| double | at | ||
| ) |
Align vertical scales of two graphics
References SciFigs::GraphicObject::_printAnchor, SciFigs::GraphContent::options(), SciFigs::GraphicObject::positionChanged(), SciFigs::SciFigsGlobal::screenResolution(), QGpCoreTools::Point2D::setY(), TRACE, QGpCoreTools::Point2D::y(), and SciFigs::GraphContentOptions::yr2s().
{
  TRACE;
  QPoint pRef(0, ref->_content->options().yr2s(at) );
  pRef=ref->_xAxis->mapToGlobal(pRef);
  QPoint pThis(0,  _content->options().yr2s(at) );
  pThis=_yAxis->mapToGlobal(pThis);
  _printAnchor.setY(_printAnchor.y() - (double) (pThis.y() - pRef.y())/SciFigsGlobal::screenResolution());
  emit positionChanged();
}
| void SciFigs::AxisWindow::browse | ( | QRect & | r | ) | [slot] |
Browses from top left to right bottom corner.
References SciFigs::Axis::currentLine(), setHorizontalLine(), setVerticalLine(), and TRACE.
Referenced by AxisWindow().
{
  TRACE;
  int dx=(int)round(10.0*r.width()/_content->width());
  if(dx!=0) {
    setHorizontalLine(_xAxis->currentLine()-dx);
    r.setLeft(r.left()+0.1*dx*_content->width());
  }
  int dy=(int)round(10.0*r.height()/_content->height());
  if(dy!=0) {
    setVerticalLine(_yAxis->currentLine()-dy);
    r.setTop(r.top()+0.1*dy*_content->height());
  }
}
| void SciFigs::AxisWindow::checkZoomRects | ( | ) | [slot] |
When changing the absolute limits of the graph, some stored zoom rect might not be valid any more.
References QGpCoreTools::Rect::intersect(), SciFigs::Axis::maximum(), SciFigs::Axis::minimum(), SciFigs::Axis::setVisibleRange(), TRACE, updateScrollBars(), SciFigs::Axis::visibleMaximum(), SciFigs::Axis::visibleMinimum(), and SciFigs::Axis::zoomEnabled.
Referenced by AxisWindow().
{
  TRACE;
  // checks if zoomRects are still inside the min and max of axis, if not deletes it
  // Constructs a rect with actual xmin,xmax,ymin,ymax
  Rect r(_xAxis->minimum(), _yAxis->minimum(), _xAxis->maximum(), _yAxis->maximum());

  if( !_zoomRects.empty()) {
    QVector<Rect>::iterator it;
    for(it=_zoomRects.begin();it!=_zoomRects.end(); )
      if( !r.includes( *it) ) it=_zoomRects.erase(it);
      else ++it;


    if(_zoomRects.empty()) {
      // All zoom rects are deleted,
      // then the actual visible area must be checked
      _zoomRects.push_back(r);
      // find intersection between old visible area and new total area
      Rect oldVis(_xAxis->visibleMinimum(), _yAxis->visibleMinimum(),
                      _xAxis->visibleMaximum(), _yAxis->visibleMaximum());
      Rect newVis=r.intersect(oldVis);
      if(_xAxis->zoomEnabled()) _xAxis->setVisibleRange(newVis.x1(), newVis.x2());
      if(_yAxis->zoomEnabled()) _yAxis->setVisibleRange(newVis.y1(), newVis.y2());
    } else
      // If there's at least one zoom rect the actual visible area is still ok
      _zoomRects.begin() ->setLimits(_xAxis->minimum(), _yAxis->minimum(),
                                      _xAxis->maximum(), _yAxis->maximum());
  } else {
    // old visible area is equal to the total area, the last has changed, thus
    // updates the former one
    if(_xAxis->zoomEnabled()) _xAxis->setVisibleRange(_xAxis->minimum(), _xAxis->maximum());
    if(_yAxis->zoomEnabled()) _yAxis->setVisibleRange(_yAxis->minimum(), _yAxis->maximum());
  }
  updateScrollBars();
}
| void SciFigs::AxisWindow::deepUpdate | ( | ) | [virtual, slot] |
Force redrawing of axis and and deep redrawing of content
Reimplemented from SciFigs::GraphicObject.
References SciFigs::GraphContent::deepUpdate(), TRACE, and SciFigs::GraphicObject::transparentMask().
Referenced by AxisWindow(), TFAResults::compute(), DampingResults::compute(), SciFigs::ColorPaletteWidget::deepUpdate(), GraphicWindow::fastFourierTransform(), HistogramWidget::fillGrid(), SpacSelector::inverse(), Seismic1DThread::modelDeepUpdate(), MagnetoTelluricThread::modelDeepUpdate(), MonoStation::WinResults::options(), ChronogramWindow::refreshSignal(), CurvesThread::resultsDeepUpdate(), DispersionGridThread::resultsDeepUpdate(), MagnetoTelluricThread::resultsDeepUpdate(), MonoStation::AbstractTool::setCurrentDisplayStation(), SignalViewer::setDisplayRange(), SciFigs::ActivityMonitor::setDisplayRange(), HistogramWidget::setHistogram(), PtMotionResults::setLimits(), PSViewer::setLimits(), SignalViewer::setMaximumTime(), SciFigs::ColorPaletteWidget::setPalette(), MonoStation::WinResults::setPeaks(), NAModelsPlot::setProperty(), SciFigs::GraphContent::setProperty(), Results::setThreshold(), MagnifierSignal::setTime(), MonoStation::StationResults::setWindowColor(), LinearFKActiveResults::setXAxis(), LinearFKActiveResults::setYAxis(), ChronogramWindow::signalsUpdate(), MapWindow::signalsUpdate(), GraphicWindow::signalsUpdate(), ChronogramWindow::subPoolUpdate(), GraphicWindow::subPoolUpdate(), updateScrollBars(), PtMotionResults::updateSignals(), and xml_polish().
{
  TRACE;
  _xAxis->update();
  _yAxis->update();
  _content->deepUpdate();
  if(transparentMask()) updateMask();
}
| GraphContent * SciFigs::AxisWindow::graphContent | ( | ) | const [inline] |
Return the content widget
Referenced by SciFigs::ActivityMonitor::ActivityMonitor(), PSViewer::addPlot(), addPlot(), ChronogramWindow::ChronogramWindow(), SciFigs::ColorPaletteWidget::ColorPaletteWidget(), createPlot(), SciFigs::GraphContentLayer::GraphContentLayer(), GraphicWindow::GraphicWindow(), SpacSelector::inverseAt(), MapWindow::MapWindow(), SpacSelector::selectSamples(), SpacSelector::setK(), RefractionTargetWidget::setLimits(), SciFigs::CurveBrowser::setLimits(), GraphicWindow::setMagnifySignal(), GraphicWindow::showMagnify(), xml_member(), xml_writeChildren(), zoomIn(), and zoomOut().
{return _content;}
| bool SciFigs::AxisWindow::isZoomed | ( | ) | const [inline] |
| void SciFigs::AxisWindow::polish | ( | ) | [virtual] |
Ensure automatic initialization of the size of children
Reimplemented from SciFigs::GraphicObject.
References SciFigs::GraphContent::polish(), SciFigs::GraphicObject::sheet(), TRACE, and updateInternalGeometry().
{
  TRACE;
  if(_content) _content->polish();
  GraphicObject::polish();
  if( !sheet()) {
    updateInternalGeometry();
  }
}
| void SciFigs::AxisWindow::print | ( | QPainter & | p, |
| double | dotpercm, | ||
| int | x0Sheet, | ||
| int | y0Sheet, | ||
| bool | mask | ||
| ) | [virtual] |
Draw the object to any device. This exclude the screen. For screen refresh the children repaint their area alone. This function is used only for printing and to export the graph as an image.
Reimplemented from SciFigs::GraphicObject.
References SciFigs::GraphContent::constScaleX(), SciFigs::GraphContent::constScaleY(), SciFigs::Axis::East, SciFigs::Axis::North, SciFigs::Axis::orientation, SciFigs::Axis::paint(), SciFigs::GraphContent::print(), SciFigs::GraphicObject::printLeft(), SciFigs::GraphicObject::printTop(), SciFigs::GraphContent::scaleX(), SciFigs::GraphContent::scaleY(), SciFigs::Axis::setPrintScale(), SciFigs::GraphContent::setProgressEnd(), and TRACE.
Referenced by SciFigs::ColorPaletteWidget::print().
{
  TRACE;
  // Compute size of both axis
  double dxWidth, dxHeight, dyWidth, dyHeight;
  calcSize(dotpercm, dxWidth, dxHeight, dyWidth, dyHeight, 0, 0, &p);
  int xWidth, xHeight, yWidth, yHeight;
  xWidth=(int) dxWidth;
  xHeight=(int) dxHeight;
  yWidth=(int) dyWidth;
  yHeight=(int) dyHeight;

  // Use exact size to compute origin (may slightly vary for other media than screen due to font scaling)
  int orX=(int) (printLeft((dxWidth+dyWidth)/dotpercm) * dotpercm) - x0Sheet;
  int orY=(int) (printTop((dxHeight+dyHeight)/dotpercm) * dotpercm) - y0Sheet;
  // Store screen scales and set print scales
  Scale originalScaleX=_content->constScaleX();
  Scale originalScaleY=_content->constScaleY();
  _xAxis->setPrintScale(xWidth, xHeight);
  _yAxis->setPrintScale(yWidth, yHeight);
  // Print GraphContent
  if(_xAxis->orientation()==Axis::North) {
    if(_yAxis->orientation()==Axis::East) {
      p.setWindow(0, 0, xWidth, yHeight);
      p.setViewport(orX + yWidth, orY, xWidth, yHeight);
    } else {
      p.setWindow(0, 0, xWidth, yHeight);
      p.setViewport(orX, orY, xWidth, yHeight);
    }
  } else {
    if(_yAxis->orientation()==Axis::East) {
      p.setWindow(0, 0, xWidth, yHeight);
      p.setViewport(orX + yWidth, orY + xHeight, xWidth, yHeight);
    } else {
      p.setWindow(0, 0, xWidth, yHeight);
      p.setViewport(orX, orY + xHeight, xWidth, yHeight);
    }
  }
  _content->print(p, dotpercm, xWidth, yHeight, mask);
  if( !mask) {
    // Print X Axis
    if(_xAxis->isEnabled()) {
      if(_xAxis->orientation()==Axis::North) {
        if(_yAxis->orientation()==Axis::East) {
          p.setWindow(0, 0, xWidth, xHeight);
          p.setViewport(orX + yWidth, orY + yHeight, xWidth, xHeight);
        } else {
          p.setWindow(0, 0, xWidth, xHeight);
          p.setViewport(orX, orY + yHeight, xWidth, xHeight);
        }
      } else {
        if(_yAxis->orientation()==Axis::East) {
          p.setWindow(0, 0, xWidth, xHeight);
          p.setViewport(orX + yWidth, orY, xWidth, xHeight);
        } else {
          p.setWindow(0, 0, xWidth, xHeight);
          p.setViewport(orX, orY, xWidth, xHeight);
        }
      }
      _xAxis->paint(p, dotpercm, xWidth, xHeight, mask);
    }
    if(_yAxis->isEnabled()) {
      // Print Y Axis
      if(_xAxis->orientation()==Axis::North) {
        if(_yAxis->orientation()==Axis::East) {
          p.setWindow(0, 0, yWidth, yHeight);
          p.setViewport(orX, orY, yWidth, yHeight);
        } else {
          p.setWindow(0, 0, yWidth, yHeight);
          p.setViewport(orX + xWidth - 1, orY, yWidth, yHeight);
        }
      } else {
        if(_yAxis->orientation()==Axis::East) {
          p.setWindow(0, 0, yWidth, yHeight);
          p.setViewport(orX, orY + xHeight, yWidth, yHeight);
        } else {
          p.setWindow(0, 0, yWidth, yHeight);
          p.setViewport(orX + xWidth - 1, orY + xHeight, yWidth, yHeight);
        }
      }
      _yAxis->paint(p, dotpercm, yWidth, yHeight, mask);
    }
  }
  // Restore screen scales
  _content->scaleX()=originalScaleX;
  _content->scaleY()=originalScaleY;
  _content->setProgressEnd(); // Progress label may persist
}
| void SciFigs::AxisWindow::removeProperties | ( | PropertyProxy * | pp | ) | [virtual] |
Reimplemented from SciFigs::GraphicObject.
References SciFigs::GraphContent::removeProperties(), SciFigs::Axis::removeProperties(), QGpGuiTools::PropertyProxy::setCurrentCategory(), TRACE, xAxis(), and yAxis().
{
  TRACE;
  GraphicObject::removeProperties(pp);
  if(pp->setCurrentCategory(_categoryXAxis) ) {
    xAxis()->removeProperties(pp);
  }
  if(pp->setCurrentCategory(_categoryYAxis) ) {
    yAxis()->removeProperties(pp);
  }
  _content->removeProperties(pp);
}
| void SciFigs::AxisWindow::restoreScaleFonts | ( | int * | fontSizeStorage | ) | [virtual] |
Restore a saved scale for fonts
Reimplemented from SciFigs::GraphicObject.
References SciFigs::Axis::font, SciFigs::GraphContent::setPrintBitmap(), and TRACE.
Referenced by SciFigs::ColorPaletteWidget::restoreScaleFonts().
{
  TRACE;
  ASSERT (fontSizeStorage!=0);
  QFont f=_xAxis->font();
  f.setPointSize(fontSizeStorage[ 0 ] );
  _xAxis->setFont(f);
  f=_yAxis->font();
  f.setPointSize(fontSizeStorage[ 1 ] );
  _yAxis->setFont(f);
  f=_content->font();
  f.setPointSize(fontSizeStorage[ 2 ] );
  _content->setFont(f);
  _content->setPrintBitmap(fontSizeStorage[ 3 ] );
  delete fontSizeStorage;
}
| int * SciFigs::AxisWindow::scaleFonts | ( | double | scale | ) | [virtual] |
For some high resolution bitmap image, fonts must scaled
Re-implentation to scale fonts in sub-widgets (axis and content)
Reimplemented from SciFigs::GraphicObject.
References SciFigs::GraphContent::printBitmap, SciFigs::GraphicObject::scaleWidgetFonts(), SciFigs::GraphContent::setPrintBitmap(), and TRACE.
Referenced by SciFigs::ColorPaletteWidget::scaleFonts().
{
  TRACE;
  int * fontSizeStorage=new int[ 4 ];
  fontSizeStorage[ 0 ]=scaleWidgetFonts(_xAxis, scale);
  fontSizeStorage[ 1 ]=scaleWidgetFonts(_yAxis, scale);
  fontSizeStorage[ 2 ]=scaleWidgetFonts(_content, scale);
  fontSizeStorage[ 3 ]=_content->printBitmap();
  _content->setPrintBitmap(true);
  return fontSizeStorage;
}
| void SciFigs::AxisWindow::setHorizontalLine | ( | int | l | ) |
| void SciFigs::AxisWindow::setMapScale | ( | double | rx1, |
| double | ry1, | ||
| double | rx2, | ||
| double | ry2 | ||
| ) | [slot] |
Automatically adjust the scale for maps
Set the scale so that the given limits will fit in the current widget size. Limits are usually given in metres
References SciFigs::Axis::isZoomed(), SciFigs::Axis::Scaled, SciFigs::SciFigsGlobal::screenResolution(), SciFigs::Axis::setMaximum(), SciFigs::Axis::setMinimum(), SciFigs::Axis::setSizeInfo(), SciFigs::Axis::setVisibleRange(), SciFigs::Axis::sizeInfo, SciFigs::Axis::sizeType, TRACE, and updateExternalGeometry().
Referenced by MapWindow::setLimits(), MonoStation::AbstractSummary::setLimits(), GeopsyGui::ArrayMap::setLimitsArray(), and GeopsyGui::ArrayMap::setLimitsCoArray().
{
  TRACE;
  if(_xAxis->sizeType()==Axis::Scaled) {
    double scaleX=100.0 * (rx2 - rx1)/(_content->width()/SciFigsGlobal::screenResolution());
    if(_yAxis->sizeType()==Axis::Scaled) {
      double scaleY=100.0 * (ry2 - ry1)/(_content->height()/SciFigsGlobal::screenResolution());
      if(scaleY > scaleX) scaleX=scaleY;
      if(fabs(_yAxis->sizeInfo()-scaleX)>0.1*scaleX) {
        scaleX=commonScale(scaleX);
      } else {
        scaleX=_yAxis->sizeInfo();
      }
      _yAxis->setSizeInfo(scaleX);
    } else {
      if(fabs(_xAxis->sizeInfo()-scaleX)>0.1*scaleX) {
        scaleX=commonScale(scaleX);
      } else {
        scaleX=_xAxis->sizeInfo();
      }
    }
    _xAxis->setSizeInfo(scaleX);
  } else if(_yAxis->sizeType()==Axis::Scaled) {
    double scaleY=100 * (ry2 - ry1)/(_content->height()/SciFigsGlobal::screenResolution());
    if(fabs(_yAxis->sizeInfo()-scaleY)>0.1*scaleY) {
      scaleY=commonScale(scaleY);
    } else {
      scaleY=_yAxis->sizeInfo();
    }
    _yAxis->setSizeInfo(scaleY);
  }
  _xAxis->setMinimum(rx1);
  _xAxis->setMaximum(rx2);
  _yAxis->setMinimum(ry1);
  _yAxis->setMaximum(ry2);
  _xAxis->setVisibleRange(_xAxis->isZoomed());
  _yAxis->setVisibleRange(_yAxis->isZoomed());
  updateExternalGeometry();
}
| void SciFigs::AxisWindow::setVerticalLine | ( | int | l | ) |
| void SciFigs::AxisWindow::swapAxes | ( | ) |
Swap axis pointers (used by ColorPaletteWidget to change orientation)
References SciFigs::GraphContent::swapAxes().
{
  Axis * tmp=_yAxis;
  _yAxis=_xAxis;
  _xAxis=tmp;
  _content->swapAxes();
}
| void SciFigs::AxisWindow::update | ( | ) | [virtual, slot] |
Force redrawing of axis and light redrawing of content
Reimplemented from SciFigs::GraphicObject.
References TRACE, and SciFigs::GraphicObject::transparentMask().
Referenced by MonoStation::StationResults::clear(), SignalDisplay::setProperty(), SignalViewer::setSignals(), and SciFigs::ColorPaletteWidget::update().
{
  TRACE;
  _xAxis->update();
  _yAxis->update();
  if(_content) _content->update();
  if(transparentMask()) updateMask();
}
| void SciFigs::AxisWindow::updateExternalGeometry | ( | ) | [slot] |
Resize the graphic calculating the total size from the size of internal widgets (Axis and content). Axis calls this function automatically when the aspect of labels or the title has changed. For scaled maps, changing the minimum and maximum of axis has an influence over the total size of the widget.
Call this function every time you modify an axis property that may have an influence over the global geometry of the graphic.
References SciFigs::GraphicObject::_printHeight, SciFigs::GraphicObject::_printWidth, SciFigs::SciFigsGlobal::screenResolution(), SciFigs::GraphicObject::sheet(), SciFigs::GraphicObject::sizeChanged(), TRACE, SciFigs::GraphicObject::transparentMask(), and updateInternalGeometry().
Referenced by SciFigs::ActivityMonitor::ActivityMonitor(), GeopsyGui::ArrayMap::ArrayMap(), AxisWindow(), ArrayGui::ArrayResponse::createObjects(), SciFigs::CurveBrowser::initLayer(), MapWindow::MapWindow(), SciFigs::GraphicSheetMenu::setGraphGeometry(), setMapScale(), SciFigs::GraphContent::setProperty(), MonoStation::WinResults::setStations(), and xml_polish().
{
  TRACE;
  int xOffset, yOffset;
  if(_xSBar->isVisible()) xOffset=16; else xOffset=0;
  if(_ySBar->isVisible()) yOffset=16; else yOffset=0;
  double xWidth, xHeight, yWidth, yHeight;
  calcSize(SciFigsGlobal::screenResolution(), xWidth, xHeight, yWidth, yHeight, xOffset, yOffset);
  _printWidth=(xWidth + yWidth + xOffset)/SciFigsGlobal::screenResolution();
  _printHeight=(xHeight + yHeight + yOffset)/SciFigsGlobal::screenResolution();
  bool tooBig=false;       // Control on size to avoid excess and X11 errors
  if(_printWidth>300.0) {   // Mainly produced by Scaled axis
    _printWidth=300.0;
    tooBig=true;
  }
  if(_printHeight>300.0) {
    _printHeight=300.0;
    tooBig=true;
  }
  if(tooBig) {
    updateInternalGeometry();
    return;
  }
  if(sheet()) {
    setAxisGeometry(( int) xWidth, (int) yWidth, (int) xHeight, (int) yHeight);
    emit sizeChanged();
    if(transparentMask()) updateMask();
  } else updateInternalGeometry();
}
| void SciFigs::AxisWindow::updateGeometry | ( | ) | [virtual, slot] |
Overload of the function inherited from GraphicObject Call to updateInternalGeometry()
Reimplemented from SciFigs::GraphicObject.
References TRACE, and updateInternalGeometry().
Referenced by PSViewer::addPlot(), PSViewer::addThreadData(), ArrayGui::ArrayResponse::createObjects(), SciFigs::GraphicSheetMenu::setGraphGeometry(), MonoStation::WinResults::setLayout(), and MonoStation::WinResults::setStations().
| void SciFigs::AxisWindow::updateInternalGeometry | ( | ) | [slot] |
Resize the graphic calculating the total size from geometry of inherited GraphicOject. The size of internal widgets (Axis and content) are changed accordingly.
Call this function every time you modify the global geometry of the graphic to update the properties of axis.
References SciFigs::SciFigsGlobal::screenResolution(), SciFigs::GraphicObject::sheet(), TRACE, and SciFigs::GraphicObject::transparentMask().
Referenced by GraphicWindow::fastFourierTransform(), HistogramWidget::HistogramWidget(), DinverDCGui::DCModelViewer::initGraphs(), polish(), SignalDisplay::setProperty(), LinearFKActiveResults::setXAxis(), LinearFKActiveResults::setYAxis(), LinearFKActiveResults::stackGrids(), ChronogramWindow::subPoolUpdate(), GraphicWindow::subPoolUpdate(), updateExternalGeometry(), updateGeometry(), zoomIn(), and zoomOut().
{
  TRACE;
  int xOffset, yOffset;
  if(_xSBar->isVisible()) xOffset=16; else xOffset=0;
  if(_ySBar->isVisible()) yOffset=16; else yOffset=0;
  if(sheet()) {
    setAxisGeometry(SciFigsGlobal::screenResolution());
    double xWidth, xHeight, yWidth, yHeight;
    calcSize(SciFigsGlobal::screenResolution(), xWidth, xHeight, yWidth, yHeight, xOffset, yOffset);
    setAxisGeometry(( int) xWidth, (int) yWidth, (int) xHeight, (int) yHeight);
  } else {
    int xWidth, xHeight, yWidth, yHeight;
    calcScreenSize(SciFigsGlobal::screenResolution(), xWidth, yHeight, xOffset, yOffset);
    xHeight=height() - yOffset - yHeight;
    yWidth=width() - xOffset - xWidth;
    setAxisGeometry(xWidth, yWidth, xHeight, yHeight);
  }
  if(transparentMask()) updateMask();
}
Automatically adjust scrollbars to the current visible area
References SciFigs::Axis::currentLine(), deepUpdate(), SciFigs::Axis::lineCount(), and TRACE.
Referenced by checkZoomRects(), zoomIn(), and zoomOut().
{
  TRACE;
  _xSBar->blockSignals(true);
  _xSBar->setMaximum(_xAxis->lineCount()-1);
  _xSBar->blockSignals(false);
  _ySBar->blockSignals(true);
  _ySBar->setMaximum(_yAxis->lineCount()-1);
  _ySBar->blockSignals(false);

  _xSBar->setValue(_xAxis->currentLine());
  _ySBar->setValue(_yAxis->currentLine());
  deepUpdate();
}
| HorizontalAxis SciFigs::AxisWindow::xAxis | ( | ) | const [inline] |
The horizontal axis of the graphic, useful to access the axis properties.
Referenced by SciFigs::ActivityMonitor::ActivityMonitor(), PSViewer::addPlot(), addPlot(), addProperties(), GeopsyGui::ArrayMap::ArrayMap(), SciFigs::ColorPaletteWidget::axis(), ChronogramWindow::ChronogramWindow(), SciFigs::ColorPaletteWidget::ColorPaletteWidget(), TFAResults::compute(), DampingResults::compute(), SciFigs::ColorPaletteLayer::coordinateTipInfo(), SciFigs::IrregularGrid2DPlot::coordinateTipInfo(), SciFigs::GraphContentLayer::coordinateTipInfo(), SciFigs::GraphContent::coordinateTipText(), MonoStation::AbstractSummary::createBubbleGraph(), MonoStation::AbstractSummary::createGridCrossSectionGraph(), TFAResults::createObjects(), DampingResults::createObjects(), SpacSelector::createObjects(), ArrayGui::ArrayResponse::createObjects(), GraphicWindow::GraphicWindow(), SciFigs::CurveBrowser::initLayer(), Seismic1DThread::initModelGraphs(), MagnetoTelluricThread::initModelGraphs(), MagnetoTelluricThread::initResultsGraphs(), MagnifierSignal::MagnifierSignal(), MapWindow::MapWindow(), SciFigs::ColorPaletteWidget::operator=(), GeopsyGui::PickLayer::paintData(), SciFigs::ColorPaletteWidget::print(), SciFigs::GraphContent::properties(), removeProperties(), SignalViewer::setDisplayRange(), SciFigs::ActivityMonitor::setDisplayRange(), ArrayGui::ArrayResponse::setFrequencySampling(), SciFigs::GraphicSheetMenu::setFrequencyTitles(), MonoStation::StationResults::setGraph(), SciFigs::GraphicSheetMenu::setGraphGeometry(), HistogramWidget::setHistogram(), HVRotateWinResults::setLimits(), SpectrumRotateWinResults::setLimits(), DinverDCGui::RefractionViewer::setLimits(), PtMotionResults::setLimits(), RefractionTargetWidget::setLimits(), AutocorrTargetWidget::setLimits(), ChronogramWindow::setLimits(), DinverDCGui::EllipticityViewer::setLimits(), DinverDCGui::MagnetoTelluricViewer::setLimits(), DinverDCGui::DispersionViewer::setLimits(), DinverDCGui::GroundModelViewer::setLimits(), DinverDCGui::AutocorrViewer::setLimits(), MonoStation::WinResults::setLimits(), DispersionGridThread::setLimits(), GraphicWindow::setLimits(), MonoStation::AbstractSummary::setLimits(), PSViewer::setLimits(), SciFigs::CurveBrowser::setLimits(), GraphicWindow::setMagnifySignal(), SignalViewer::setMaximumTime(), Seismic1DThread::setModelLimits(), MagnetoTelluricThread::setModelLimits(), SciFigs::ColorPaletteWidget::setPalette(), NAModelsPlot::setParamX(), NAModelsPlot::setProperty(), SciFigs::GraphContent::setProperty(), StructureWinResults::setRatioLimits(), HVRotateStation::setResultGraph(), SpectrumRotateStation::setResultGraph(), CurvesThread::setResultsLimits(), MagnetoTelluricThread::setResultsLimits(), MagnifierSignal::setSignal(), StructureWinResults::setSpectrumLimits(), MagnifierSignal::setTime(), DinverDCGui::RefractionViewer::setTitles(), DinverDCGui::EllipticityViewer::setTitles(), DinverDCGui::DispersionViewer::setTitles(), DinverDCGui::GroundModelViewer::setTitles(), DinverDCGui::AutocorrViewer::setTitles(), DinverDCGui::MagnetoTelluricViewer::setTitles(), LinearFKActiveResults::setXAxis(), GraphicWindow::showMagnify(), GraphicWindow::signalsUpdate(), SignalViewer::SignalViewer(), LinearFKActiveResults::stackGrids(), MonoStation::StatisticResults::studentTest(), ChronogramWindow::updateLabels(), GraphicWindow::updateLabels(), and PtMotionResults::updateSignals().
{return _xAxis;}
| XMLMember SciFigs::AxisWindow::xml_member | ( | XML_MEMBER_ARGS | ) | [protected, virtual] |
Re-implement this function to offer XML restore (children and properties) support to your class.
From tag and map (with contains the attibute value) return a unique identifier under the format of a XMLMember. XMLMember is initialized with 3 types of contructors:
Map of attributes can be inspected in this way (can be achived also in xml_setProperty()):
    static const QString tmp("childrenName");
    XMLRestoreAttributeIterator it=map.find(tmp);
    if(it!=map.end()) {
      // found attribute "childrenName"
    }
If the map of attributes is not used:
    Q_UNUSED(attributes);
    if(tag=="x1") return XMLMember(0);
    else if(tag=="y1") return XMLMember(1);
    else if(tag=="x2") return XMLMember(2);
    else if(tag=="y2") return XMLMember(3);
    else return XMLMember(XMLMember::Unknown);
Arithmetic operations + and - apply to XMLMember to avoid confusion of property id numbers between inherited objects. Offset 3 corresponds to the number of properties defined in this object.
    if(tag=="anInteger") return XMLMember(0);
    else if(tag=="aString") return XMLMember(1);
    else if(tag=="aDouble") return XMLMember(2);
    return AbstractLine::xml_member(tag, attributes, context)+3;
For the arguments of this function use Macro XML_MEMBER_ARGS.
Reimplemented from SciFigs::GraphicObject.
References SciFigs::GraphContent::delayPainting(), QGpCoreTools::endl(), graphContent(), QGpCoreTools::tr(), and TRACE.
{
  TRACE;
  if(tag=="Axis") {
    static const QString tmp( "orientation" );
    XMLRestoreAttributeIterator it=attributes.find(tmp);
    if(it!=attributes.end()) {
      if(it.value()=="Horizontal" )
        return XMLMember(_xAxis);
      else if(it.value()=="Vertical" )
        return XMLMember(_yAxis);
      else {
        App::stream() << tr( "Bad axis orientation: %1" ).arg(it.value().toString()) << endl;
        return XMLMember(XMLMember::Unknown);
      }
    } else {
      App::stream() << tr( "Attribute orientation not found" ) << endl;
      return XMLMember(XMLMember::Unknown);
    }
  } else if(tag=="GraphContent" ) {
    // Lock any redraw of this graph
    graphContent()->delayPainting();
    return XMLMember(graphContent());
  }
  return GraphicObject::xml_member(tag, attributes, context);
}
| void SciFigs::AxisWindow::xml_polish | ( | XML_POLISH_ARGS | ) | [virtual] |
Reimplemented from SciFigs::GraphicObject.
References deepUpdate(), SciFigs::Axis::maximum(), SciFigs::Axis::minimum(), SciFigs::Axis::setVisibleRange(), TRACE, and updateExternalGeometry().
Referenced by SciFigs::ColorPaletteWidget::xml_polishChild().
{
  TRACE;
  _xAxis->setVisibleRange(_xAxis->minimum(), _xAxis->maximum());
  _yAxis->setVisibleRange(_yAxis->minimum(), _yAxis->maximum());
  deepUpdate();
  updateExternalGeometry();
  GraphicObject::xml_polish(context);
}
| virtual const QString& SciFigs::AxisWindow::xml_tagName | ( | ) | const [inline, virtual] |
Reimplemented from SciFigs::GraphicObject.
{return xmlAxisWindowTag;}
| void SciFigs::AxisWindow::xml_writeChildren | ( | XML_WRITECHILDREN_ARGS | ) | const [protected, virtual] |
Reimplemented from QGpCoreTools::XMLClass.
References QGpCoreTools::XMLSaveAttributes::add(), graphContent(), TRACE, and QGpCoreTools::XMLClass::xml_save().
{
  TRACE;
  static const QString key("orientation"), valueVertical("Vertical"), valueHorizontal("Horizontal");
  GraphicObject::xml_writeChildren(s, context);
  XMLSaveAttributes att;
  QString& value=att.add(key);
  value=valueHorizontal;
  _xAxis->xml_save(s, context, att);
  value=valueVertical;
  _yAxis->xml_save(s, context, att);
  graphContent() ->xml_save(s, context);
}
| VerticalAxis SciFigs::AxisWindow::yAxis | ( | ) | const [inline] |
The vertical axis of the graphic, useful to access the axis properties.
Referenced by SciFigs::ActivityMonitor::ActivityMonitor(), PSViewer::addPlot(), addPlot(), addProperties(), GeopsyGui::ArrayMap::ArrayMap(), SciFigs::ColorPaletteWidget::axis(), ChronogramWindow::ChronogramWindow(), SciFigs::ColorPaletteWidget::ColorPaletteWidget(), TFAResults::compute(), DampingResults::compute(), SciFigs::IrregularGrid2DPlot::coordinateTipInfo(), SciFigs::GraphContentLayer::coordinateTipInfo(), SciFigs::GraphContent::coordinateTipText(), MonoStation::AbstractSummary::createBubbleGraph(), MonoStation::AbstractSummary::createGridCrossSectionGraph(), TFAResults::createObjects(), DampingResults::createObjects(), SpacSelector::createObjects(), ArrayGui::ArrayResponse::createObjects(), MonoStation::AbstractSummary::createSpectrumGridGraph(), GraphicWindow::GraphicWindow(), HistogramWidget::HistogramWidget(), HistogramWidget::initGrid(), SciFigs::CurveBrowser::initLayer(), Seismic1DThread::initModelGraphs(), MagnetoTelluricThread::initModelGraphs(), EllipticityThread::initResultsGraphs(), SpacSelector::inverse(), MonoStation::WinResults::loadResults(), MapWindow::MapWindow(), DinverDCGui::GroundModelViewer::minMaxProfiles(), SciFigs::ColorPaletteWidget::operator=(), SciFigs::ColorPaletteWidget::print(), SciFigs::GraphContent::properties(), removeProperties(), MonoStation::AbstractSummary::setBubbleValues(), MonoStation::AbstractTool::setCurrentDisplayStation(), SciFigs::GraphicSheetMenu::setFrequencyTitles(), DinverDCGui::GroundModelViewer::setGlobalLimits(), MonoStation::StationResults::setGraph(), SciFigs::GraphicSheetMenu::setGraphGeometry(), HistogramWidget::setHistogram(), HVRotateWinResults::setLimits(), SpectrumRotateWinResults::setLimits(), DinverDCGui::RefractionViewer::setLimits(), PtMotionResults::setLimits(), RefractionTargetWidget::setLimits(), ChronogramWindow::setLimits(), AutocorrTargetWidget::setLimits(), DinverDCGui::EllipticityViewer::setLimits(), DinverDCGui::MagnetoTelluricViewer::setLimits(), DinverDCGui::DispersionViewer::setLimits(), DinverDCGui::AutocorrViewer::setLimits(), MonoStation::WinResults::setLimits(), DispersionGridThread::setLimits(), GraphicWindow::setLimits(), MonoStation::AbstractSummary::setLimits(), PSViewer::setLimits(), SciFigs::CurveBrowser::setLimits(), Seismic1DThread::setModelLimits(), MagnetoTelluricThread::setModelLimits(), SciFigs::ColorPaletteWidget::setPalette(), NAModelsPlot::setParamY(), NAModelsPlot::setProperty(), SciFigs::GraphContent::setProperty(), StructureWinResults::setRatioLimits(), SpectrumRotateStation::setResultGraph(), HVRotateStation::setResultGraph(), CurvesThread::setResultsLimits(), MagnetoTelluricThread::setResultsLimits(), SignalViewer::setSignals(), StructureWinResults::setSpectrumLimits(), MonoStation::WinResults::setStations(), DinverDCGui::RefractionViewer::setTitles(), DinverDCGui::EllipticityViewer::setTitles(), DinverDCGui::DispersionViewer::setTitles(), DinverDCGui::AutocorrViewer::setTitles(), DinverDCGui::MagnetoTelluricViewer::setTitles(), DinverDCGui::GroundModelViewer::setTitles(), LinearFKActiveResults::setYAxis(), GraphicWindow::signalsUpdate(), SignalViewer::SignalViewer(), LinearFKActiveResults::stackGrids(), MonoStation::StatisticResults::studentTest(), ChronogramWindow::updateLabels(), GraphicWindow::updateLabels(), and PtMotionResults::updateSignals().
{return _yAxis;}
| void SciFigs::AxisWindow::zoomIn | ( | double | rx1, |
| double | ry1, | ||
| double | rx2, | ||
| double | ry2 | ||
| ) | [slot] |
Zoom in to a specified rectangle
References SciFigs::GraphContent::action(), SciFigs::GraphContent::deepUpdate(), graphContent(), isZoomed(), MAX_INT, SciFigs::Axis::Scaled, SciFigs::Axis::setVisibleRange(), SciFigs::Axis::sizeType, TRACE, updateInternalGeometry(), updateScrollBars(), SciFigs::Axis::visibleMaximum(), SciFigs::Axis::visibleMinimum(), and SciFigs::Axis::zoomEnabled.
Referenced by AxisWindow().
{
  TRACE;
  // Avoid integer overflow for scrollbars
  if(_xSBar->maximum() > MAX_INT/2 || _ySBar->maximum() > MAX_INT/2) return ;
  // save actual visible rectangle to zoom rectangles stack
  if(!isZoomed()) {
    _xSBar->show();
    _ySBar->show();
    updateInternalGeometry();
    QAction * a;
    a=_content->action("Unzoom");
    if(a) a->setEnabled(true);
    a=_content->action("Browse");
    if(a) a->setEnabled(true);
  }
  _zoomRects.push_back(Rect( _xAxis->visibleMinimum(), _yAxis->visibleMinimum(),
                                 _xAxis->visibleMaximum(), _yAxis->visibleMaximum()) );
  if(_xAxis->sizeType()==Axis::Scaled &&
       _yAxis->sizeType()==Axis::Scaled) {
    // Both axis are scaled, hence zoom in must respect the x/y ratio
    double ratio=(_xAxis->visibleMaximum() - _xAxis->visibleMinimum()) /
                   (_yAxis->visibleMaximum() - _yAxis->visibleMinimum());
    if(ratio > 0 && ratio < 1000) {
      if(rx2 < rx1) {double tmp=rx2; rx2=rx1; rx1=tmp;}
      double dx=rx2 - rx1;
      if(ry2 < ry1) {double tmp=ry2; ry2=ry1; ry1=tmp;}
      double dy=ry2 - ry1;
      if(dy * ratio > dx) rx2=rx1 + dy * ratio;
      else ry1=ry2 - dx/ratio;
    }
  }
  if(_xAxis->zoomEnabled()) _xAxis->setVisibleRange(rx1, rx2);
  if(_yAxis->zoomEnabled()) _yAxis->setVisibleRange(ry1, ry2);
  updateScrollBars();
  graphContent()->deepUpdate();
}
| void SciFigs::AxisWindow::zoomOut | ( | ) | [slot] |
Zoom out to the visible area before last zoomIn
References SciFigs::GraphContent::action(), SciFigs::GraphContent::browse(), SciFigs::GraphContent::deepUpdate(), graphContent(), isZoomed(), SciFigs::Axis::setVisibleRange(), TRACE, updateInternalGeometry(), updateScrollBars(), QGpCoreTools::Rect::x1(), QGpCoreTools::Rect::x2(), QGpCoreTools::Rect::y1(), QGpCoreTools::Rect::y2(), and SciFigs::Axis::zoomEnabled.
Referenced by AxisWindow().
{
  TRACE;
  // retrieve last visible rectangle
  if(!isZoomed()) return;
  Rect r=_zoomRects.back();
  _zoomRects.pop_back();
  if(!isZoomed()) {
    QAction * a;
    a=_content->action("Unzoom");
    if(a) a->setEnabled(false);
    a=_content->action("Browse");
    if(a) a->setEnabled(false);
    _content->browse(); // Force removal of Browse tracking
    _xSBar->hide();
    _ySBar->hide();
    updateInternalGeometry();
  }

  if(_xAxis->zoomEnabled()) _xAxis->setVisibleRange(r.x1(), r.x2());
  if(_yAxis->zoomEnabled()) _yAxis->setVisibleRange(r.y1(), r.y2());

  updateScrollBars();
  graphContent()->deepUpdate();
}
const QString SciFigs::AxisWindow::xmlAxisWindowTag = "AxisWindow" [static] |
QString SciFigs::AxisWindow::gridLines [read, write] |
QString SciFigs::AxisWindow::printBitmap [read, write] |
QString SciFigs::AxisWindow::printLineWeight [read, write] |
