

All Classes Namespaces Files Functions Variables Typedefs Enumerations Enumerator Properties Friends Defines
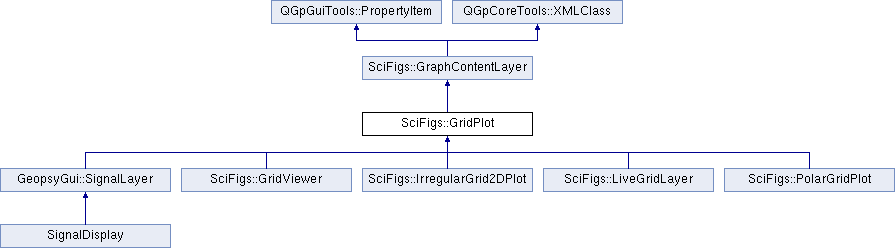
A GridPlot is the base class for all layers that draw colored grids. More...
#include <GridPlot.h>
Public Slots | |
| void | setPalette (const ColorPalette &pal) |
Signals | |
| void | paletteChanged (const ColorPalette &pal) |
Public Member Functions | |
| virtual void | addProperties (PropertyProxy *pp) |
| Rect::Area | fillType () const |
| double | fillValue () const |
| GridPlot (AxisWindow *parent) | |
| virtual bool | hasProperties () |
| const ColorPalette & | palette () const |
| virtual void | properties (PropertyWidget *w) const |
| virtual void | removeProperties (PropertyProxy *pp) |
| void | setFillType (Rect::Area ft) |
| void | setFillValue (double v) |
| void | setLinearPalette (double minVal, double maxVal) |
| virtual void | setProperty (uint wid, int pid, QVariant val) |
| void | setShowGrid (bool b) |
| void | setSmooth (bool b) |
| bool | showGrid () const |
| bool | smooth () const |
| virtual const QString & | xml_tagName () const |
| ~GridPlot () | |
Static Public Attributes | |
| static const QString | xmlGridPlotTag = "GridViewer" |
Protected Member Functions | |
| void | drawGridLines (QPainter &p, const IrregularGrid2DDraw &d) const |
| template<class ValueType > | |
| void | drawGridLines (const Grid2D< ValueType > &grid, const LayerPainterRequest &lp, QPainter &p) const |
| virtual XMLMember | xml_member (XML_MEMBER_ARGS) |
| virtual void | xml_polishChild (XML_POLISHCHILD_ARGS) |
| virtual void | xml_writeChildren (XML_WRITECHILDREN_ARGS) const |
Static Protected Member Functions | |
| template<class ValueType > | |
| static void | drawGrid2DBlock (const Grid2D< ValueType > &grid, ColorPalette pal, const LayerPainterRequest &lp, QPainter &p) |
| static void | drawGrid2DBlock (const IrregularGrid2D &grid, ColorPalette pal, const LayerPainterRequest &lp, QPainter &p, const IrregularGrid2DDraw &d) |
| static void | drawGrid2DSmooth (const IrregularGrid2D &grid, ColorPalette pal, const LayerPainterRequest &lp, QPainter &p, IrregularGrid2DDraw &d) |
| template<class ValueType > | |
| static void | drawGrid2DYSmooth (const Grid2D< ValueType > &grid, ColorPalette pal, const LayerPainterRequest &lp, QPainter &p) |
Protected Attributes | |
| Rect::Area | _fillType |
| double | _fillValue |
| ColorPalette | _pal |
Properties | |
| bool | showGrid |
| bool | smooth |
A GridPlot is the base class for all layers that draw colored grids.
| SciFigs::GridPlot::GridPlot | ( | AxisWindow * | parent | ) |
References _pal, QGpGuiTools::ColorPalette::defaultHSVColors(), SciFigs::GraphContentLayer::setOpacity(), and TRACE.
                                      :
    GraphContentLayer(parent)
{
  TRACE;
  _pal.defaultHSVColors(255, 240, 128, 255);
  _showGrid=false;
  _smooth=true;
  setOpacity(0.8);
}
| void SciFigs::GridPlot::addProperties | ( | PropertyProxy * | pp | ) | [virtual] |
Setup property editor
Reimplemented from SciFigs::GraphContentLayer.
Reimplemented in GeopsyGui::SignalLayer, and SciFigs::LiveGridLayer.
References QGpGuiTools::PropertyProxy::addReference(), QGpGuiTools::PropertyProxy::addTab(), QGpGuiTools::PropertyProxy::setCurrentTab(), QGpCoreTools::tr(), TRACE, and w.
{
  TRACE;
  if(pp->setCurrentTab(_tabPalette)) {
    pp->addReference(this);
  } else {
    PaletteProperties * w=new PaletteProperties;
    pp->addTab(_tabPalette, tr("Palette"), w, this);
  }
  if(pp->setCurrentTab(_tabGrid)) {
    pp->addReference(this);
  } else {
    GridProperties * w=new GridProperties;
    pp->addTab(_tabGrid, tr("Grid format"), w, this);
  }
}
| void SciFigs::GridPlot::drawGrid2DBlock | ( | const Grid2D< ValueType > & | grid, |
| ColorPalette | pal, | ||
| const LayerPainterRequest & | lp, | ||
| QPainter & | p | ||
| ) | [static, protected] |
References SciFigs::GraphContentOptions::ax(), SciFigs::GraphContentOptions::ay(), QGpGuiTools::ColorPalette::color(), QGpCoreTools::Grid2D< ValueType >::deltaX(), QGpCoreTools::Grid2D< ValueType >::deltaY(), QGpCoreTools::Grid2D< ValueType >::nx(), QGpCoreTools::Grid2D< ValueType >::ny(), SciFigs::LayerPainterRequest::options(), QGpCoreTools::Grid2D< ValueType >::origin(), SciFigs::LayerPainterRequest::terminated(), TRACE, QGpCoreTools::Grid2D< ValueType >::valuePointer(), QGpCoreTools::Point2D::x(), SciFigs::GraphContentOptions::xr2s(), SciFigs::GraphContentOptions::xVisMax(), SciFigs::GraphContentOptions::xVisMin(), QGpCoreTools::Point2D::y(), SciFigs::GraphContentOptions::yr2s(), SciFigs::GraphContentOptions::yVisMax(), and SciFigs::GraphContentOptions::yVisMin().
Referenced by SciFigs::GridViewer::paintData(), SciFigs::IrregularGrid2DPlot::paintData(), SciFigs::LiveGridLayer::paintData(), and GeopsyGui::SignalLayer::paintData().
{
  TRACE;
  const GraphContentOptions& gc=lp.options();

  double startx, ddx, stopx, x;
  double starty, ddy, stopy, y;
  int startix, startiy;
  int y1, y2, x1, x2, dy, dmx, dmy;

  ddx=grid.deltaX();
  ddy=grid.deltaY();
  startx=grid.origin().x() - ddx * 0.5;
  starty=grid.origin().y() - ddy * 0.5;
  stopx=startx + (double) grid.nx() * ddx;
  stopy=starty + (double) grid.ny() * ddy;

  // Find first x and stopx
  if(startx > gc.xVisMin()) {
    if(startx > gc.xVisMax()) return ;
    startix=0;
  } else {
    if(stopx < gc.xVisMin()) return ;
    startix=(int) floor(( gc.xVisMin() - startx)/ddx);
    startx += (double) startix * ddx;
  }
  stopx -= 0.5 * ddx;
  if(stopx > gc.xVisMax()) stopx=gc.xVisMax();

  // Find first starty and stopy
  if(starty > gc.yVisMin()) {
    if(starty > gc.yVisMax()) return ;
    y=starty;
    startiy=0;
  } else {
    if(stopy < gc.yVisMin()) return ;
    startiy=(int) floor(( gc.yVisMin() - starty)/ddy);
    y=starty + (double) startiy * ddy;
  }
  stopy -= 0.5 * ddy;
  if(stopy > gc.yVisMax()) stopy=gc.yVisMax();

  // Adjust ddx, increase it if less than a pixel
  if(fabs( gc.ax() * ddx) < 1.0) {
    dmx=(int) ceil(( double) 1.0/fabs(gc.ax() * ddx) );
    ddx *= (double) dmx;
  } else dmx=1;

  // Adjust ddy, increase it if less than a pixel
  if(fabs( gc.ay() * ddy) < 1.0) {
    dmy=(int) ceil(( double) 1.0/fabs(gc.ay() * ddy) );
    ddy *= (double) dmy;
    dmy *= grid.nx();
  } else dmy=grid.nx();

  const double * valx, *valy;
  valy=grid.valuePointer(startix, startiy);
  y2=gc.yr2s(y);
  for( ; y < stopy; ) {
    if(lp.terminated()) return;
    y1=y2;
    y += ddy;
    y2=gc.yr2s(y);
    dy=y2 - y1;
    valx=valy;
    valy += dmy;
    x2=gc.xr2s(startx);
    for(x=startx; x < stopx; valx += dmx) {
      x1=x2;
      x += ddx;
      x2=gc.xr2s(x);
      p.fillRect (x1, y1, x2 - x1, dy, pal.color( *valx) );
    }
  }
}
| void SciFigs::GridPlot::drawGrid2DBlock | ( | const IrregularGrid2D & | grid, |
| ColorPalette | pal, | ||
| const LayerPainterRequest & | lp, | ||
| QPainter & | p, | ||
| const IrregularGrid2DDraw & | d | ||
| ) | [static, protected] |
References QGpGuiTools::ColorPalette::color(), SciFigs::LayerPainterRequest::graphContent(), SciFigs::Scale::isEffectivelyReversed(), SciFigs::IrregularGrid2DDraw::limx, SciFigs::IrregularGrid2DDraw::limy, SciFigs::IrregularGrid2DDraw::nx, QGpCoreTools::IrregularGrid2D::nx(), SciFigs::IrregularGrid2DDraw::ny, QGpCoreTools::IrregularGrid2D::ny(), SciFigs::LayerPainterRequest::options(), SciFigs::GraphContentOptions::scaleX(), SciFigs::GraphContentOptions::scaleY(), SciFigs::GraphContent::setProgressMaximum(), SciFigs::GraphContent::setProgressValue(), SciFigs::IrregularGrid2DDraw::stopix, SciFigs::IrregularGrid2DDraw::stopiy, SciFigs::LayerPainterRequest::terminated(), TRACE, and QGpCoreTools::IrregularGrid2D::valuePointer().
{
  TRACE;
  const GraphContentOptions& gc=lp.options();
  if(grid.nx()==0 || grid.ny()==0) return;

  // Draw all visible grid cells, taking care of axis order
  lp.graphContent()->setProgressMaximum(d.ny);
  const double * valx, * valy=grid.valuePointer(d.stopix, d.stopiy);
  int y, dy;
  if(gc.scaleX().isEffectivelyReversed()) {
    if(gc.scaleY().isEffectivelyReversed()) {
      for(int iy=d.ny;iy > 0;iy-- ) {
        if(lp.terminated()) return;
        lp.graphContent()->setProgressValue(d.ny-iy);
        y=d.limy[ iy - 1 ];
        dy=d.limy[ iy ] - y;
        valx=valy;
        valy -= grid.nx();
        for(int ix=d.nx;ix > 0;ix--, valx-- ) {
          const QColor& col=pal.color( *valx);
          if(col!=Qt::white) p.fillRect (d.limx[ ix ], y, d.limx[ ix - 1 ] - d.limx[ ix ], dy, col);
        }
      }
    } else {
      for(int iy=d.ny;iy > 0;iy-- ) {
        if(lp.terminated()) return;
        lp.graphContent()->setProgressValue(d.ny-iy);
        y=d.limy[ iy ];
        dy=d.limy[ iy - 1 ] - y;
        valx=valy;
        valy -= grid.nx();
        for(int ix=d.nx;ix > 0;ix--, valx-- ) {
          const QColor& col=pal.color( *valx);
          if(col!=Qt::white) p.fillRect (d.limx[ ix ], y, d.limx[ ix - 1 ] - d.limx[ ix ], dy, col);
        }
      }
    }
  } else {
    if(gc.scaleY().isEffectivelyReversed()) {
      for(int iy=d.ny;iy > 0;iy-- ) {
        if(lp.terminated()) return;
        lp.graphContent()->setProgressValue(d.ny-iy);
        y=d.limy[ iy - 1 ];
        dy=d.limy[ iy ] - y;
        valx=valy;
        valy -= grid.nx();
        for(int ix=d.nx;ix > 0;ix--, valx-- ) {
          const QColor& col=pal.color( *valx);
          if(col!=Qt::white) p.fillRect (d.limx[ ix - 1 ], y, d.limx[ ix ] - d.limx[ ix - 1 ], dy, col);
        }
      }
    } else {
      for(int iy=d.ny;iy > 0;iy-- ) {
        if(lp.terminated()) return;
        lp.graphContent()->setProgressValue(d.ny-iy);
        y=d.limy[ iy ];
        dy=d.limy[ iy - 1 ] - y;
        valx=valy;
        valy -= grid.nx();
        for(int ix=d.nx;ix > 0;ix--, valx-- ) {
          const QColor& col=pal.color( *valx);
          if(col!=Qt::white) p.fillRect (d.limx[ ix - 1 ], y, d.limx[ ix ] - d.limx[ ix - 1 ], dy, col);
        }
      }
    }
  }
  if(lp.terminated()) return;
  lp.graphContent()->setProgressValue(d.ny);
}
| void SciFigs::GridPlot::drawGrid2DSmooth | ( | const IrregularGrid2D & | grid, |
| ColorPalette | pal, | ||
| const LayerPainterRequest & | lp, | ||
| QPainter & | p, | ||
| IrregularGrid2DDraw & | d | ||
| ) | [static, protected] |
References QGpGuiTools::ColorPalette::color(), QGpGuiTools::ColorPalette::count(), SciFigs::LayerPainterRequest::graphContent(), QGpGuiTools::ColorPalette::index(), SciFigs::Scale::isEffectivelyReversed(), QGpGuiTools::ColorPalette::lowerValue(), SciFigs::IrregularGrid2DDraw::nodex, SciFigs::IrregularGrid2DDraw::nodey, QGpCoreTools::IrregularGrid2D::nx(), QGpCoreTools::IrregularGrid2D::ny(), SciFigs::LayerPainterRequest::options(), SciFigs::GraphContentOptions::scaleX(), SciFigs::GraphContentOptions::scaleY(), SciFigs::GraphContent::setProgressMaximum(), SciFigs::GraphContent::setProgressValue(), SciFigs::LayerPainterRequest::size(), SciFigs::IrregularGrid2DDraw::startix, SciFigs::IrregularGrid2DDraw::startiy, SciFigs::IrregularGrid2DDraw::stopix, SciFigs::IrregularGrid2DDraw::stopiy, SciFigs::LayerPainterRequest::terminated(), TRACE, QGpGuiTools::ColorPalette::upperValue(), QGpCoreTools::IrregularGrid2D::value(), and w.
Referenced by SciFigs::IrregularGrid2DPlot::paintData(), and SciFigs::LiveGridLayer::paintData().
{
  TRACE;
  const GraphContentOptions& gc=lp.options();
  if(grid.nx()==0 || grid.ny()==0) return;
  /*
    Variable description:
    --------------------

    xsc, ysc                 screen coordinates of the current grid cell
    xs, ys                   screen coordinates inside the current grid cell
    nextXs, nextYs           screen coordinates of the next grid cell
    xi, yi                   grid index of the current cell
    dxi, dyi                 grid increments necessary to scan the grid from top-left to bottom-right (-1 or 1)
    nextXi, nextYi           grid index the next grid cell
    v1 to v4                 values of the grid in the neighbour cells, v1 for current cell, v4 for next cell
    v13, v24                 interpolated values at the current screen Y between, v1-v3 and v2-v4, respectivelly
    c13, c24                 slopes along Y axis
    c                        slope along X axis at the current screen Y
    coliY                    current color index at the current screen Y between v1 and v3
    coliX                    current color index (along X axis)
    nextColYs                next Y where the color index will change between v1 and v3
    nextColXs                next X where the color index will change on the current screen Y axis
    curCol                   current color
  */
  int xsc, xs, xi, nextXi, nextXs, nextXsR,dxi;
  int ysc, ys, yi, nextYi, nextYs, nextYsR,dyi;
  double v1, v2, v3, v4, c13, v13, c24, v24, c;
  int coliY, coliX, nextColYs, nextColXs;
  uint curCol;
  // Node vectors with global indexes
  int * gnodex, * gnodey;

  if(gc.scaleX().isEffectivelyReversed()) {
    dxi=-1;
    int tmp=d.startix;
    d.startix=d.stopix;
    d.stopix=tmp;
    gnodex=d.nodex - d.stopix;
  } else {
    dxi=1;
    gnodex=d.nodex - d.startix;
  }
  if(gc.scaleY().isEffectivelyReversed()) {
    dyi=1;
    gnodey=d.nodey - d.startiy;
  } else {
    dyi=-1;
    int tmp=d.startiy;
    d.startiy=d.stopiy;
    d.stopiy=tmp;
    gnodey=d.nodey - d.stopiy;
  }

  // Create an image that intersects the current visible rect and the grid rect
  int w=lp.size().width();
  int h=lp.size().height();
  int imageMinX=gnodex[ d.startix ];
  if(imageMinX<0) imageMinX=0;
  else if(imageMinX>w) return; // nothing to draw
  int imageMaxX=gnodex[ d.stopix ];
  if(imageMaxX<0) return; // nothing to draw
  else if(imageMaxX>w) imageMaxX=w;
  int imageMinY=gnodey[ d.startiy ];
  if(imageMinY<0) imageMinY=0;
  else if(imageMinY>h) return; // nothing to draw
  int imageMaxY=gnodey[ d.stopiy ];
  if(imageMaxY<0) return; // nothing to draw
  else if(imageMaxY>h) imageMaxY=h;
  w=imageMaxX-imageMinX+1;
  h=imageMaxY-imageMinY+1;
  QImage im(w, h, QImage::Format_ARGB32);
  // Translate node screen coordinates to have them in image coordinates
  for(int xi=d.startix; notEnd(xi, d.stopix, dxi); xi+=dxi) gnodex[ xi ]-=imageMinX;
  for(int yi=d.startiy; notEnd(yi, d.stopiy, dyi); yi+=dyi) gnodey[ yi ]-=imageMinY;
  uint * imPtr=(uint * ) im.bits();

  lp.graphContent()->setProgressMaximum(h);
  yi=d.startiy;
  ysc=gnodey[ yi ];
  while(notEnd( yi, d.stopiy, dyi) && ysc < h) {
    if(lp.terminated()) return;
    lp.graphContent()->setProgressValue(ysc);
    xi=d.startix;
    xsc=gnodex[ xi ];
    nextYi=yi + dyi;
    if(nextYi >= grid.ny() || nextYi < 0) break;
    nextYs=gnodey[ nextYi ];
    v2=grid.value(xi, yi);
    v4=grid.value(xi, nextYi);
    c24=(v4 - v2)/(double) (nextYs - ysc);
    while(notEnd( xi, d.stopix, dxi) && xsc < w) {
      nextXi=xi + dxi;
      if(nextXi >= grid.nx() || nextXi < 0) break;
      xsc=gnodex[ xi ];
      nextXs=gnodex[ nextXi ];
      v1=v2;
      v2=grid.value(nextXi, yi);
      v3=v4;
      v4=grid.value(nextXi, nextYi);
      c13=c24;
      c24=(v4 - v2)/(double) (nextYs - ysc);
      coliY=pal.index(v1);
      if(ysc < 0) ys=0; else ys=ysc;
      if(nextYs < h) nextYsR=nextYs; else nextYsR=h - 1;
      uint * imCell=imPtr + ys * w;
      while(ys <= nextYsR) {
        double nextColYsD;
        if(v1 < v3 && coliY < pal.count()) {
          nextColYsD= ysc + round(( pal.upperValue(coliY) - v1)/c13);
          if(nextColYsD > nextYsR)
            nextColYs=nextYsR;
          else
            nextColYs=(int) nextColYsD;
        } else if(v1 > v3 && coliY > 0) {
          nextColYsD= ysc + round(( pal.lowerValue(coliY) - v1)/c13);
          if(nextColYsD > nextYsR)
            nextColYs=nextYsR;
          else
            nextColYs=(int) nextColYsD;
        } else nextColYs=nextYsR;
        while(ys <= nextColYs) {
          int dys=ys - ysc;
          v13=v1 + c13 * dys;
          v24=v2 + c24 * dys;
          c=(double)(nextXs - xsc)/(v24 - v13);
          coliX=coliY;
          if(xsc < 0) xs=0; else xs=xsc;
          if(nextXs < w) nextXsR=nextXs; else nextXsR=w - 1;
          while(xs <= nextXsR) {
            curCol=static_cast<uint>(pal.color(coliX).rgba());
            double nextColXsD;
            if(v13 < v24 && coliX < pal.count()) {
              nextColXsD= xsc +round(( pal.upperValue(coliX) - v13) * c);
              if(nextColXsD > nextXsR)
                nextColXs=nextXsR;
              else
                nextColXs=(int)  nextColXsD;
            } else if(v13 > v24 && coliX > 0) {
              nextColXsD=xsc +round(( pal.lowerValue(coliX) - v13) * c);
              if(nextColXsD > nextXsR)
                nextColXs=nextXsR;
              else
                nextColXs=(int) nextColXsD;
            } else nextColXs=nextXsR;
            while(xs <= nextColXs) {
              imCell[ xs ]=curCol;
              xs++;
            }
            if(v13 < v24) coliX++;
            else if(v13 > v24) coliX--;
          }
          imCell += w;
          ys++;
        }
        if(v1 < v3) coliY++;
        else if(v1 > v3) coliY--;
      }
      xi=nextXi;
      xsc=nextXs;
    }
    yi=nextYi;
    ysc=nextYs;
  }
  if(lp.terminated()) return;
  lp.graphContent()->setProgressValue(h);
  p.drawImage(imageMinX, imageMinY, im);
}
| void SciFigs::GridPlot::drawGrid2DYSmooth | ( | const Grid2D< ValueType > & | grid, |
| ColorPalette | pal, | ||
| const LayerPainterRequest & | lp, | ||
| QPainter & | p | ||
| ) | [static, protected] |
References SciFigs::GraphContentOptions::ax(), SciFigs::GraphContentOptions::ay(), QGpGuiTools::ColorPalette::color(), QGpCoreTools::Grid2D< ValueType >::deltaX(), QGpCoreTools::Grid2D< ValueType >::deltaY(), QGpGuiTools::ColorPalette::index(), QGpCoreTools::Grid2D< ValueType >::nx(), QGpCoreTools::Grid2D< ValueType >::ny(), SciFigs::LayerPainterRequest::options(), QGpCoreTools::Grid2D< ValueType >::origin(), SciFigs::LayerPainterRequest::terminated(), TRACE, QGpGuiTools::ColorPalette::upperValue(), QGpCoreTools::Grid2D< ValueType >::valuePointer(), QGpCoreTools::Point2D::x(), SciFigs::GraphContentOptions::xr2s(), SciFigs::GraphContentOptions::xVisMax(), SciFigs::GraphContentOptions::xVisMin(), QGpCoreTools::Point2D::y(), SciFigs::GraphContentOptions::yr2s(), SciFigs::GraphContentOptions::yVisMax(), and SciFigs::GraphContentOptions::yVisMin().
Referenced by GeopsyGui::SignalLayer::paintData().
{
  TRACE;
  const GraphContentOptions& gc=lp.options();

  double startx, ddx, stopx, x;
  double starty, ddy, stopy, y;
  double coef;
  int startix, startiy, dmx, dmy;
  int y1, y2, x1, x2, dx, dy, dlim, limx, limxdy, yn1, yn2;

  ddx=grid.deltaX();
  ddy=grid.deltaY();
  startx=grid.origin().x() - ddx * 0.5;
  starty=grid.origin().y();
  stopx=startx + (double) grid.nx() * ddx;
  stopy=starty + (double) (grid.ny() - 1) * ddy;

  // Find first x and stopx
  if(startx > gc.xVisMin()) {
    if(startx > gc.xVisMax()) return ;
    startix=0;
  } else {
    if(stopx < gc.xVisMin()) return ;
    startix=(int) floor(( gc.xVisMin() - startx)/ddx);
    startx += (double) startix * ddx;
  }
  stopx -= 0.5 * ddx;
  if(stopx > gc.xVisMax()) stopx=gc.xVisMax();

  // Find first starty and stopy
  if(starty > gc.yVisMin()) {
    if(starty > gc.yVisMax()) return ;
    y=starty;
    startiy=0;
  } else {
    if(stopy < gc.yVisMin()) return ;
    startiy=(int) floor(( gc.yVisMin() - starty)/ddy);
    y=starty + (double) startiy * ddy;
  }
  stopy -= 0.5 * ddy;
  if(stopy > gc.yVisMax()) stopy=gc.yVisMax();

  // Adjust ddx, increase it if less than a pixel
  if(fabs( gc.ax() * ddx) < 1.0) {
    dmx=(int) ceil(( double) 1.0/fabs(gc.ax() * ddx) );
    ddx *= (double) dmx;
  } else dmx=1;

  // Adjust ddy, increase it if less than a pixel
  if(fabs( gc.ay() * ddy) < 1.0) {
    dmy=(int) ceil(( double) 1.0/fabs(gc.ay() * ddy) );
    ddy *= (double) dmy;
    dmy *= grid.nx();
  } else dmy=grid.nx();

  const double * valx, * valy, * valxdy;
  valy=grid.valuePointer(startix, startiy);
  y2=gc.yr2s(y);
  for( ; y < stopy; ) {
    if(lp.terminated()) return;
    y1=y2;
    y += ddy;
    y2=gc.yr2s(y);
    dy=y1 - y2;
    valx=valy;
    valy += dmy;
    valxdy=valy;
    x2=gc.xr2s(startx);
    for(x=startx; x < stopx; valx += dmx, valxdy += dmx) {
      x1=x2;
      x += ddx;
      x2=gc.xr2s(x);
      dx=x2 - x1;
      limx=pal.index( *valx);
      limxdy=pal.index( *valxdy);
      dlim=limxdy - limx;
      if(dlim==0) p.fillRect (x1, y2, dx, dy, pal.color(limx) );
      else {
        coef=(( double) dy)/( *valx - *valxdy);
        yn2=y1;
        if(dlim > 0) {
          dlim=1;
          for(int lim=limx;lim < limxdy;lim += dlim) {
            yn1=yn2;
            yn2=(int) (coef * (pal.upperValue(lim) - *valx) ) + y1;
            if(yn1!=yn2)
              p.fillRect (x1, yn2, dx, yn1 - yn2, pal.color(lim) );
            else if(lim!=limx) dlim=dlim << 1;
          }
        } else {
          dlim=1;
          for(int lim=limx - 1;lim >= limxdy;lim -= dlim) {
            yn1=yn2;
            yn2=(int) (coef * (pal.upperValue(lim) - *valx) ) + y1;
            if(yn1!=yn2)
              p.fillRect (x1, yn2, dx, yn1 - yn2, pal.color(lim + 1) );
            else if(lim!=limx - 1) dlim=dlim << 1;
          }
        }
        if(yn2!=y2)
          p.fillRect (x1, y2, dx, yn2 - y2, pal.color(limxdy) );
      }
    }
  }
}
| void SciFigs::GridPlot::drawGridLines | ( | QPainter & | p, |
| const IrregularGrid2DDraw & | d | ||
| ) | const [protected] |
Draw the cell limits.
All members of d must be initialized, so call getCellLimits() before!
References SciFigs::IrregularGrid2DDraw::limx, SciFigs::IrregularGrid2DDraw::limy, SciFigs::IrregularGrid2DDraw::nx, SciFigs::IrregularGrid2DDraw::ny, and TRACE.
Referenced by SciFigs::GridViewer::paintData(), and SciFigs::IrregularGrid2DPlot::paintData().
{
  TRACE;
  int y;
  int x0=d.limx[ 0 ], x1=d.limx[ d.nx ];
  for(int iy=d.ny;iy >= 0;iy-- ) {
    y=d.limy[ iy ];
    p.drawLine (x0, y, x1, y);
  }
  x0=d.limy[ 0 ]; x1=d.limy[ d.ny ];
  for(int ix=d.nx;ix >= 0;ix-- ) {
    y=d.limx[ ix ];
    p.drawLine (y, x0, y, x1);
  }
  // Draw cell indexes (debug only)
  // Multi thread painting not compatible with draw text !!!
  /*QString iText( "(%1,%2)" );
  for(int iy=d.ny - 1;iy >= 0;iy-- ) {
    for(int ix=d.nx - 1;ix >= 0;ix-- ) {
      p.drawText (d.nodex[ ix ], d.nodey[ iy ], iText.arg(ix + d.startix).arg(iy + d.startiy) );
    }
  }*/
}
| void SciFigs::GridPlot::drawGridLines | ( | const Grid2D< ValueType > & | grid, |
| const LayerPainterRequest & | lp, | ||
| QPainter & | p | ||
| ) | const [protected] |
References QGpCoreTools::Grid2D< ValueType >::east(), QGpCoreTools::Grid2D< ValueType >::north(), QGpCoreTools::Grid2D< ValueType >::nx(), QGpCoreTools::Grid2D< ValueType >::ny(), SciFigs::LayerPainterRequest::options(), QGpCoreTools::Grid2D< ValueType >::south(), TRACE, QGpCoreTools::Grid2D< ValueType >::west(), SciFigs::GraphContentOptions::xr2s(), and SciFigs::GraphContentOptions::yr2s().
{
  TRACE;
  const GraphContentOptions& gc=lp.options();
  int x, y;
  int x0=gc.xr2s(grid.west(0)), x1=gc.xr2s(grid.east(grid.nx()-1));
  for(int iy=grid.ny()-1; iy>=0; iy--) {
    y=gc.yr2s(grid.south(iy));
    p.drawLine(x0, y, x1, y);
  }
  y=gc.yr2s(grid.north(0));
  p.drawLine(x0, y, x1, y);
  int y0=gc.yr2s(grid.south(0)), y1=gc.yr2s(grid.north(grid.ny()-1));
  for(int ix=grid.nx()-1;ix >= 0;ix-- ) {
    x=gc.xr2s(grid.east(ix));
    p.drawLine(x, y0, x, y1);
  }
  x=gc.xr2s(grid.west(0));
  p.drawLine(x, y0, x, y1);
}
| Rect::Area SciFigs::GridPlot::fillType | ( | ) | const [inline] |
Referenced by properties().
{return _fillType;}
| double SciFigs::GridPlot::fillValue | ( | ) | const [inline] |
Referenced by properties().
{return _fillValue;}
| virtual bool SciFigs::GridPlot::hasProperties | ( | ) | [inline, virtual] |
Reimplemented from SciFigs::GraphContentLayer.
Reimplemented in GeopsyGui::SignalLayer, and SciFigs::LiveGridLayer.
{return true;}
| const ColorPalette& SciFigs::GridPlot::palette | ( | ) | const [inline] |
Referenced by SpacSelector::inverse(), SciFigs::GridViewer::paintData(), SciFigs::IrregularGrid2DPlot::paintData(), SciFigs::LiveGridLayer::paintData(), GeopsyGui::SignalLayer::paintData(), properties(), HistogramWidget::select(), HistogramWidget::setHistogram(), and setLinearPalette().
{return _pal;}
| void SciFigs::GridPlot::paletteChanged | ( | const ColorPalette & | pal | ) | [signal] |
Referenced by setLinearPalette(), and setPalette().
| void SciFigs::GridPlot::properties | ( | PropertyWidget * | w | ) | const [virtual] |
Reimplemented from SciFigs::GraphContentLayer.
Reimplemented in GeopsyGui::SignalLayer, and SciFigs::LiveGridLayer.
References SciFigs::GridProperties::area2item(), SciFigs::GridProperties::FillType, fillType(), SciFigs::GridProperties::FillValue, fillValue(), SciFigs::GridProperties::FillValueInversed, QGpGuiTools::PropertyWidget::id(), SciFigs::PaletteProperties::Palette, palette(), QGpGuiTools::PropertyWidget::setValue(), SciFigs::GridProperties::ShowGrid, showGrid(), SciFigs::GridProperties::Smooth, smooth(), and TRACE.
{
  TRACE;
  if(w->id()==_tabPalette) {
    w->setValue(PaletteProperties::Palette, QVariant::fromValue(palette()));
  } else if(w->id()==_tabGrid) {
    w->setValue(GridProperties::ShowGrid, showGrid());
    w->setValue(GridProperties::Smooth, smooth());
    w->setValue(GridProperties::FillValue, fillValue());
    w->setValue(GridProperties::FillValueInversed, 1.0/fillValue());
    w->setValue(GridProperties::FillType, GridProperties::area2item(fillType()) );
  }
}
| void SciFigs::GridPlot::removeProperties | ( | PropertyProxy * | pp | ) | [virtual] |
Clean property editor
Reimplemented from SciFigs::GraphContentLayer.
Reimplemented in GeopsyGui::SignalLayer, and SciFigs::LiveGridLayer.
References QGpGuiTools::PropertyProxy::removeTab().
| void SciFigs::GridPlot::setFillType | ( | Rect::Area | ft | ) | [inline] |
Referenced by setProperty().
{_fillType=ft;}
| void SciFigs::GridPlot::setFillValue | ( | double | v | ) | [inline] |
Referenced by setProperty().
{_fillValue=v;}
| void SciFigs::GridPlot::setLinearPalette | ( | double | minVal, |
| double | maxVal | ||
| ) |
Set a linear scale on palette. Safe for painting threads. For other modification of the palette see setPalette().
Reimplemented in SciFigs::IrregularGrid2DPlot.
References _pal, palette(), paletteChanged(), QGpGuiTools::ColorPalette::setVLinear(), and TRACE.
Referenced by Simulator::init(), SciFigs::IrregularGrid2DPlot::setLinearPalette(), and GeopsyGui::SignalLayer::SignalLayer().
{
  TRACE;
  LayerLocker ll(this);
  _pal.setVLinear(minVal, maxVal);
  emit paletteChanged(palette());
}
| void SciFigs::GridPlot::setPalette | ( | const ColorPalette & | pal | ) | [slot] |
Set the palette. Safe for painting threads.
References _pal, SciFigs::GraphContent::deepUpdate(), SciFigs::GraphContentLayer::graphContent(), paletteChanged(), and TRACE.
Referenced by createGridPlot(), ArrayGui::ArrayResponse::createObjects(), MonoStation::AbstractSummary::createSpectrumGridGraph(), SpacSelector::inverse(), HistogramWidget::select(), HistogramWidget::setHistogram(), setProperty(), SpectrumRotateWinResults::setStations(), HVRotateWinResults::setStations(), and xml_polishChild().
{
  TRACE;
  // Avoid recurrent loop
  static bool locked=false;
  if(!locked) {
    locked=true;
    LayerLocker ll(this);
    _pal=pal;
    // This layer takes generally time to repaint (useless to repaint only this layer)
    graphContent()->deepUpdate();
    emit paletteChanged(pal);
    locked=false;
  }
}
| void SciFigs::GridPlot::setProperty | ( | uint | wid, |
| int | pid, | ||
| QVariant | val | ||
| ) | [virtual] |
Reimplemented from SciFigs::GraphContentLayer.
Reimplemented in GeopsyGui::SignalLayer, SciFigs::LiveGridLayer, and SignalDisplay.
References SciFigs::GraphContent::deepUpdate(), SciFigs::GridProperties::FillType, SciFigs::GridProperties::FillValue, SciFigs::GridProperties::FillValueInversed, SciFigs::GraphContentLayer::graphContent(), SciFigs::GridProperties::item2area(), SciFigs::PaletteProperties::Palette, setFillType(), setFillValue(), setPalette(), setShowGrid(), setSmooth(), SciFigs::GridProperties::ShowGrid, SciFigs::GridProperties::Smooth, and TRACE.
{
  TRACE;
  if(wid==_tabPalette) {
    switch(pid) {
    case PaletteProperties::Palette:
      setPalette(val.value<ColorPalette>());
      break;
    default:
      break;
    }
  } else if(wid==_tabGrid) {
    LayerLocker ll(this);
    switch(pid) {
    case GridProperties::ShowGrid:
      setShowGrid(val.toBool());
      graphContent()->deepUpdate();
      break;
    case GridProperties::Smooth:
      setSmooth(val.toBool());
      graphContent()->deepUpdate();
      break;
    case GridProperties::FillType:
      setFillType(GridProperties::item2area(val.toInt()) );
      break;
    case GridProperties::FillValue:
      setFillValue(val.toDouble());
      break;
    case GridProperties::FillValueInversed:
      setFillValue(1.0/val.toDouble());
    default:
      break;
    }
  }
}
| void SciFigs::GridPlot::setShowGrid | ( | bool | b | ) | [inline] |
Referenced by setProperty().
{_showGrid=b;}
| void SciFigs::GridPlot::setSmooth | ( | bool | b | ) | [inline] |
Referenced by TFAResults::compute(), and setProperty().
{_smooth=b;}
| bool SciFigs::GridPlot::showGrid | ( | ) | const [inline] |
Referenced by SciFigs::GridViewer::paintData(), SciFigs::IrregularGrid2DPlot::paintData(), and properties().
{return _showGrid;}
| bool SciFigs::GridPlot::smooth | ( | ) | const [inline] |
Referenced by SciFigs::IrregularGrid2DPlot::paintData(), SciFigs::LiveGridLayer::paintData(), GeopsyGui::SignalLayer::paintData(), and properties().
{return _smooth;}
| XMLMember SciFigs::GridPlot::xml_member | ( | XML_MEMBER_ARGS | ) | [protected, virtual] |
Re-implement this function to offer XML restore (children and properties) support to your class.
From tag and map (with contains the attibute value) return a unique identifier under the format of a XMLMember. XMLMember is initialized with 3 types of contructors:
Map of attributes can be inspected in this way (can be achived also in xml_setProperty()):
    static const QString tmp("childrenName");
    XMLRestoreAttributeIterator it=map.find(tmp);
    if(it!=map.end()) {
      // found attribute "childrenName"
    }
If the map of attributes is not used:
    Q_UNUSED(attributes);
    if(tag=="x1") return XMLMember(0);
    else if(tag=="y1") return XMLMember(1);
    else if(tag=="x2") return XMLMember(2);
    else if(tag=="y2") return XMLMember(3);
    else return XMLMember(XMLMember::Unknown);
Arithmetic operations + and - apply to XMLMember to avoid confusion of property id numbers between inherited objects. Offset 3 corresponds to the number of properties defined in this object.
    if(tag=="anInteger") return XMLMember(0);
    else if(tag=="aString") return XMLMember(1);
    else if(tag=="aDouble") return XMLMember(2);
    return AbstractLine::xml_member(tag, attributes, context)+3;
For the arguments of this function use Macro XML_MEMBER_ARGS.
Reimplemented from SciFigs::GraphContentLayer.
Reimplemented in GeopsyGui::SignalLayer, and SciFigs::GridViewer.
References _pal, SciFigs::XMLSciFigs::data(), and TRACE.
{
  TRACE;
  XMLSciFigs * scifigsContext=static_cast<XMLSciFigs *>(context);
  if(scifigsContext->data()) {
    if(tag=="ColorPalette") return XMLMember(&_pal);
  }
  return GraphContentLayer::xml_member(tag, attributes, context);
}
| void SciFigs::GridPlot::xml_polishChild | ( | XML_POLISHCHILD_ARGS | ) | [protected, virtual] |
Reimplemented from QGpCoreTools::XMLClass.
Reimplemented in GeopsyGui::SignalLayer.
References setPalette().
{
  Q_UNUSED(context);
  if(child->xml_tagName()=="ColorPalette") {
    setPalette( *static_cast<ColorPalette *>(child));
  }
}
| virtual const QString& SciFigs::GridPlot::xml_tagName | ( | ) | const [inline, virtual] |
Reimplemented from SciFigs::GraphContentLayer.
Reimplemented in GeopsyGui::SignalLayer, SciFigs::LiveGridLayer, SciFigs::GridViewer, and SciFigs::IrregularGrid2DPlot.
{return xmlGridPlotTag;}
| void SciFigs::GridPlot::xml_writeChildren | ( | XML_WRITECHILDREN_ARGS | ) | const [protected, virtual] |
Reimplemented from QGpCoreTools::XMLClass.
Reimplemented in GeopsyGui::SignalLayer, SciFigs::LiveGridLayer, and SciFigs::GridViewer.
References _pal, SciFigs::XMLSciFigs::data(), TRACE, and QGpCoreTools::XMLClass::xml_save().
{
  TRACE;
  XMLSciFigs * scifigsContext=static_cast<XMLSciFigs *>(context);
  if(scifigsContext->data()) {
    _pal.xml_save(s, context);
  }
  GraphContentLayer::xml_writeChildren(s, context);
}
Rect::Area SciFigs::GridPlot::_fillType [protected] |
Referenced by SciFigs::GridViewer::trackRectangle(), and SciFigs::IrregularGrid2DPlot::trackRectangle().
double SciFigs::GridPlot::_fillValue [protected] |
Referenced by SciFigs::GridViewer::trackRectangle(), and SciFigs::IrregularGrid2DPlot::trackRectangle().
ColorPalette SciFigs::GridPlot::_pal [protected] |
Referenced by GridPlot(), setLinearPalette(), setPalette(), xml_member(), and xml_writeChildren().
const QString SciFigs::GridPlot::xmlGridPlotTag = "GridViewer" [static] |
bool SciFigs::GridPlot::showGrid [read, write] |
bool SciFigs::GridPlot::smooth [read, write] |
