Geopsy-fk
Contents
Signal database preparation
This step is performed with Geopsy graphical interface. If you have followed all steps for the preparation of a database, loading coordinates and grouping, you should have now a set of simultaneously recorded waveforms associated in a group and containing coordinates for each waveform.
Note that from release 3.4.0, it is possible to load signal files directly from the command line without creating a database. The file headers must have the correct absolute time and the sensor coordinates.
Alternatively, you can download a ready-to-go database file and the corresponding waveform files at this location. Note that you have to re-locate your waveform files as described in detail in this page. Or without a graphical interface:
 $ geopsy-fk -db Lep_ring01_3C.gpy -fix-signal-paths
 ----WARNING--- Opening Database...----
 File '/home/mao/GEOPSY_DOC_WORKSHOP/RING01_SHORT/WA.WAU01..HHE.D.2010.056.000' does not exist.
 The path may have changed. Would you like to manually select its new location?
   1. Yes <-- default
   2. No
 ?
Hit enter or answer '1', 'y' or 'yes'.
Show this message again? [y]/n
Hit enter or answer 'y' or 'yes'.
 ---- Opening Database... ----
   Filter: Signal file (WA.WAU01..HHE.D.2010.056.000)
   Current directory: /tmp
   Please select file '/home/mao/GEOPSY_DOC_WORKSHOP/RING01_SHORT/WA.WAU01..HHE.D.2010.056.000' in its new location.
 File to open:
Provide the absolute or the relative path to the requested file(s). For instance:
RING01_SHORT/WA.WAU01..HHE.D.2010.056.000
Files having similar paths are automatically translated. At the end the database is saved with your local paths. You can check that all paths are correct by re-starting the same command: you should get no output message. You can also view the signals in a graphical user interface:
$ geopsy Lep_ring01_3C.gpy
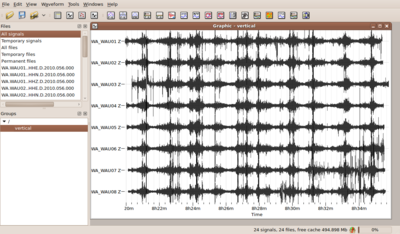
This database contains two predefined groups: vertical and 3C. Please test if you can view
the signals: use drag and drop functionality and check the coordinate settings in the
table view or map view. If you display the predefined group vertical
in a graphic viewer, you should obtain a picture similar to the one displayed on the right.
Another way to get the list of groups is:
 $ geopsy-fk -db Lep_ring01_3C.gpy -groups
 geopsy-fk: Default groups
 geopsy-fk: Default groups/All signals
 geopsy-fk: Default groups/Temporary signals
 geopsy-fk: Default groups/All files
 geopsy-fk: Default groups/Temporary files
 geopsy-fk: Default groups/Permanent files
 geopsy-fk: Default groups/By names
 geopsy-fk: Default groups/By components
 geopsy-fk: Default groups/By receivers
 geopsy-fk: Default groups/By sources
 geopsy-fk: vertical
 geopsy-fk: 3C
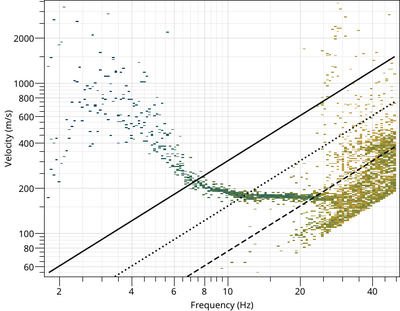
Single component high resolution FK
The simplest way to invoke geopsy-fk is:
$ geopsy-fk -db ../Lep_ring01_3C.gpy -group vertical
Input parameters are automatically adjusted and results are saved in file 'capon-vertical.max'. By default,
- the minimum velocity is set to 50 m/s,
- time windows are 100-period long,
- the minimum frequency is set to have at least 50 time windows (TO CHECK),
- the maximum frequency is set to Nyquist frequency,
- 2N blocks are used to calculate the cross spectral matrices where N is the number of sensors.
These values can be changed by providing a parameter file:
$ geopsy-fk -db Lep_ring01_3C.gpy -group-path vertical -param my.param -o my
where my.param can be for instance:
 PERIOD_COUNT=100
 MINIMUM_FREQUENCY=1
 MAXIMUM_FREQUENCY=30
 MIN_V=125
 BLOCK_COUNT_FACTOR=1
 RELATIVE_THRESHOLD (%)=10
Parameter RELATIVE_THRESHOLD selects all FK peaks whose amplitude is higher that 10% of the maximum peak. Option -o adds a prefix to the automatic output file name which is by default process_type-group_name.max. Alternatively, parameters can be modified directly in the command line:
$ geopsy-fk -db Lep_ring01_3C.gpy -group-path vertical -param my.param -o my -set-param "MIN_V=100"
In this last case, the parameters are first loaded from my.param and then MIN_V is set to 100 instead of 125 m/s. The order of the options -param and -set-param matters and they can be used several times.
There are many other secondary parameters. To get a list of all possible parameters and their default values, run:
$ geopsy-fk -param-example
Results can be viewed with:
$ gphistogram my-vertical.max
.max files save the command line arguments, the complete version of geopsy-fk and its dependencies, the parameters and the results. The history of arguments can be also accessed through
$ geopsy-fk -args
Both commands support online help with
$ geopsy-fk -h all
Single component conventional FK
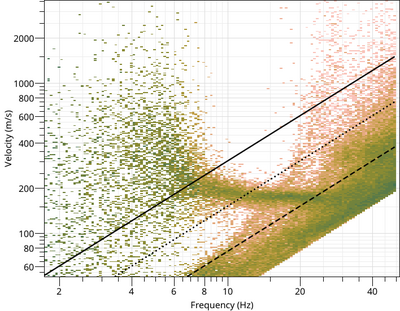
To run a conventional FK without block averaging as in geopsy graphical user interface before 2018:
$ geopsy-fk -db Lep_ring01_3C.gpy -group-path vertical -param conv.param
where conv.param can be for instance:
 MINIMUM_FREQUENCY=1
 MAXIMUM_FREQUENCY=30
 FREQ_BAND_WIDTH=0.1
 PROCESS_TYPE=Conventional
 BLOCK_COUNT=1
 STATISTIC_COUNT=0
 MIN_V (m/s)=100
 RELATIVE_THRESHOLD (%)=10
Rayleigh Three-component BeamForming (RTBF)
The method is described in Wathelet et al. (2018) [1]. A typical parameter file can be (e.g. rtbf.param):
 MINIMUM_FREQUENCY=1
 MAXIMUM_FREQUENCY=30
 FREQ_BAND_WIDTH=0.1
 PROCESS_TYPE=RTBF
 ROTATE_STEP_COUNT=72
 BLOCK_COUNT_FACTOR=4
 MIN_V (m/s)=100
 STATISTIC_MAX_OVERLAP(%)=100
 RELATIVE_THRESHOLD (%)=10
Parameter STATISTIC_MAX_OVERLAP adjusts the overlap between two block sets. At 100%, the block set is shifted by one block. At 0%, the block set is shifted by the number of blocks in the block set to avoid any overlap. Any intermediate value is possible. To run a three-component FK:
$ geopsy-fk -db Lep_ring01_3C.gpy -group-path 3C -param rtbf.param
Note that the selected group must have the three components available for all sensors.
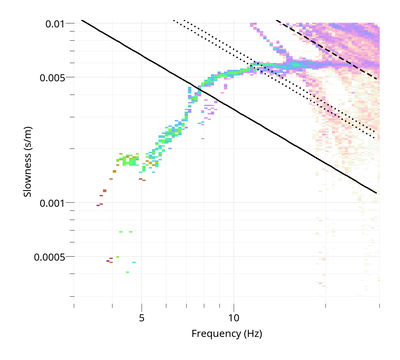
To view the Rayleigh dispersion curve:
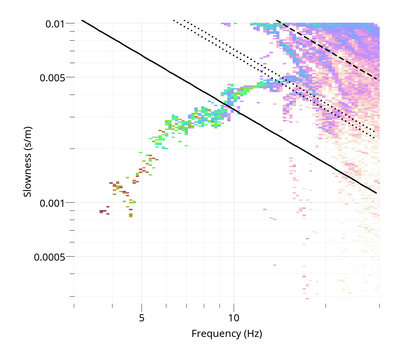
$ gphistogram rtbf-3C.max -p R
The option -p defines a pattern to select the result lines of file .max which contains a polarization column either Vertical, Rayleigh or Love. To view the Love dispersion curve:
$ gphistogram rtbf-3C.max -p L
Love dispersion curve is computed in the same way as in Poggi et al. (2010) [2]. To view the Rayleigh ellipticity curve:
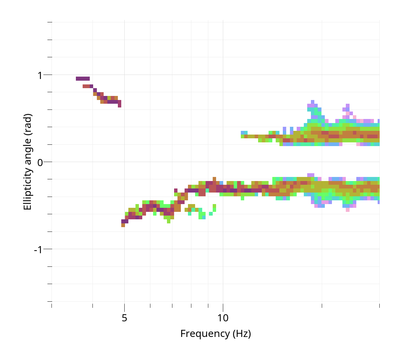
$ gphistogram rtbf-3C.max -p R -ell-angle
To view the ratio of incoherent over coherent noise:
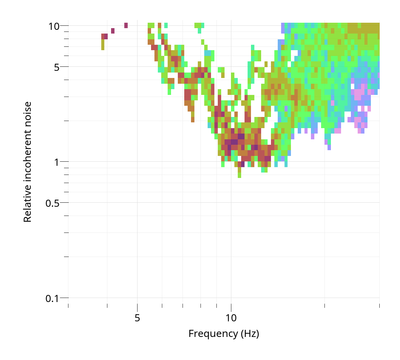
$ gphistogram rtbf-3C.max -p R -noise
Miscellaneous
The produced .max files contain an application signature in the header. The signature lists the arguments and the code version (with the Git commit ID). To re-run a case, for instance with new options or a new version, the .max file can be directly executed in a shell (from geopsypack-3.4.2).
bash old_results-rtbf-group1.max
New options can be added.
bash old_results-rtbf-group1.max -o new_results
The last option avoids overwriting the original file "old_results-rtbf-group1.max". Even if the original arguments had an option "-o", only the last one is kept.
References
- ↑ Wathelet, M, Guillier, B, Roux, P, Cornou, C. and Ohrnberger, M., Rayleigh wave three-component beamforming: signed ellipticity assessment from high-resolution frequency-wavenumber processing of ambient vibration arrays, Geophysical Journal International, 215(1), 507-523.
- ↑ Poggi, V. and Fäh, D., 2010, Estimating Rayleigh wave particle motion from three-component array analysis of ambient vibrations, Geophysical Journal International, 180(1), 251–267
