Geopsy-fk
Contents
Signal database preparation
This step is performed with Geopsy graphical interface. If you have followed all steps for the preparation of a database, loading coordinates and grouping, you should have now a set of simultaneously recorded waveforms building a group and containing coordinates for each waveform.
Alternatively, you can download a ready-to-go database file and the corresponding waveform files at this location. Note that you have to re-locate your waveform files as described in detail in this page. Or without a graphical interface:
 $ geopsy-fk -db Lep_ring01_3C.gpy -fix-signal-paths
 ----WARNING--- Opening Database...----
 File '/home/mao/GEOPSY_DOC_WORKSHOP/RING01_SHORT/WA.WAU01..HHE.D.2010.056.000' does not exist.
 The path may have changed. Would you like to manually select its new location?
   1. Yes <-- default
   2. No
 ?
Hit enter or answer '1', 'y' or 'yes'.
Show this message again? [y]/n
Hit enter or answer 'y' or 'yes'.
 ---- Opening Database... ----
   Filter: Signal file (WA.WAU01..HHE.D.2010.056.000)
   Current directory: /tmp
   Please select file '/home/mao/GEOPSY_DOC_WORKSHOP/RING01_SHORT/WA.WAU01..HHE.D.2010.056.000' in its new location.
 File to open:
Provide the absolute or the relative path to the requested file(s). For instance:
RING01_SHORT/WA.WAU01..HHE.D.2010.056.000
Files having similar paths are automatically translated. At the end the database is saved with your local paths. You can check that all paths are correct by re-starting the same command: you should get no output message. You can also view the signals in a graphical user interface:
$ geopsy Lep_ring01_3C.gpy
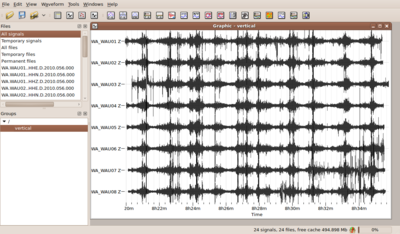
This database contains two predefined groups: vertical and 3C. Please test, whether you can view
the signals, use drag and drop functionality or check the coordinate settings in the
table view or map view. If you display the predefined group vertical
in a graphic viewer, you should obtain a picture similar to the one displayed on the right.
Another way to get the list of groups is:
 $ geopsy-fk -db Lep_ring01_3C.gpy -groups
 geopsy-fk: Default groups
 geopsy-fk: Default groups/All signals
 geopsy-fk: Default groups/Temporary signals
 geopsy-fk: Default groups/All files
 geopsy-fk: Default groups/Temporary files
 geopsy-fk: Default groups/Permanent files
 geopsy-fk: Default groups/By names
 geopsy-fk: Default groups/By components
 geopsy-fk: Default groups/By receivers
 geopsy-fk: Default groups/By sources
 geopsy-fk: vertical
 geopsy-fk: 3C
Single component high resolution FK
The simplest way to invoke geopsy-fk is:
$ geopsy-fk -db ../Lep_ring01_3C.gpy -group vertical
Input parameters are automatically adjusted and results are saved in file 'a-vertical.max'. By default,
- the maximum velocity is set to 50 m/s,
- time windows are 100-period long,
- the minimum frequency is set to have at least 50 time windows,
- the maximum frequency is set to Nyquist frequency,
- 2N blocks are used to calculate the cross spectral matrices where N is the number of sensors.
These values can be changed by providing a parameter file:
$ geopsy-fk -db Lep_ring01_3C.gpy -group-path vertical -param my.param -o my
where my.param can be for instance:
 PERIOD_COUNT=100
 MINIMUM_FREQUENCY=1
 MAXIMUM_FREQUENCY=30
 MIN_V=125
 BLOCK_COUNT_FACTOR=1
 RELATIVE_THRESHOLD (%)=10
Parameter RELATIVE_THRESHOLD selects all FK peaks whose amplitude is higher that 10% of the maximum peak. Option -o modifies the output base name which is by default a. Alternatively, parameters can be modified directly in the command line:
$ geopsy-fk -db Lep_ring01_3C.gpy -group-path vertical -param my.param -o my -set-param "MIN_V=100"
In this last case, the parameters are first loaded from my.param and then MIN_V is set to 100 instead of 125 m/s. The order of the options -param and -set-param matters and they can be used several times.
There are many other secondary parameters. To get a list of all possible parameters and their default values, run:
$ geopsy-fk -param-example
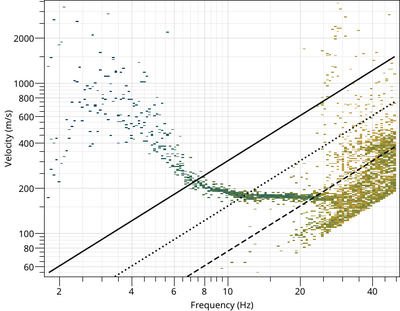
Results can be viewed with:
$ gphistogram my-vertical.max
.max files save the command line arguments, the complete version of geopsy-fk and its dependencies, the parameters and the results. The history of arguments can be also accessed through
$ geopsy-fk -args
Both commands support online help with
$ geopsy-fk -h all
Single component conventional FK
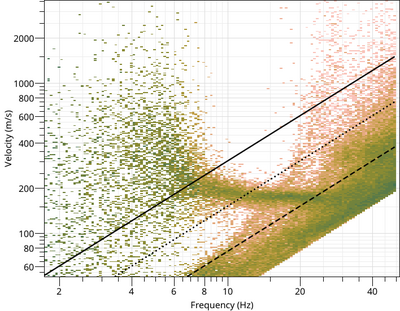
To run a conventional FK without block averaging as in geopsy graphical user interface before 2018:
$ geopsy-fk -db Lep_ring01_3C.gpy -group-path vertical -param conv.param -o conv
where conv.param can be for instance:
 MINIMUM_FREQUENCY=1
 MAXIMUM_FREQUENCY=30
 FREQ_BAND_WIDTH=0.1
 PROCESS_TYPE=Conventional
 BLOCK_COUNT=1
 STATISTIC_COUNT=0
 MIN_V (m/s)=100
 RELATIVE_THRESHOLD (%)=10
Rayleigh Three-component BeamForming (RTBF)
The method is described in Wathelet et al. (2018) [1]. A typical parameter file can be (e.g. rtbf.param):
 MINIMUM_FREQUENCY=1
 MAXIMUM_FREQUENCY=30
 FREQ_BAND_WIDTH=0.1
 PROCESS_TYPE=Projections
 ROTATE_STEP_COUNT=72
 BLOCK_COUNT_FACTOR=4
 MIN_V (m/s)=100
 STATISTIC_MAX_OVERLAP(%)=100
 RELATIVE_THRESHOLD (%)=10
Parameter STATISTIC_MAX_OVERLAP adjusts the overlap between two block sets. At 100%, the block set is shifted by one block. At 0%, the block set is shifted by the number of blocks in the block set to avoid any overlap. Any intermediate value is possible. To run a three-component FK:
$ geopsy-fk -db Lep_ring01_3C.gpy -group-path 3C -param rtbf.param -o rtbf
Note that the selected group must have the three components available for all sensors.
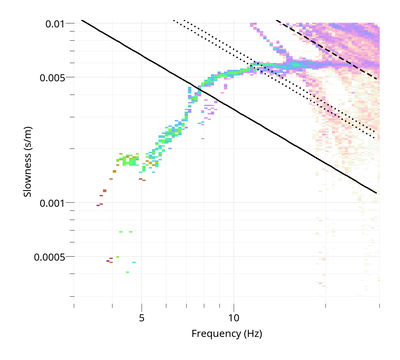
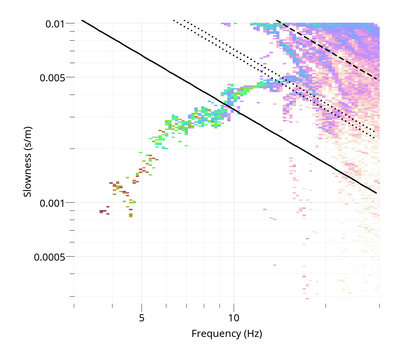
To view the Rayleigh dispersion curve:
$ gphistogram rtbf-3C.max -p R
The option -p defines a pattern to select the result lines of file .max which contains a polarization column either Vertical, Rayleigh or Love. To view the Love dispersion curve:
$ gphistogram rtbf-3C.max -p L
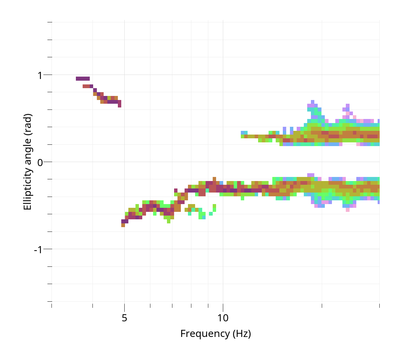
Love dispersion curve is computed in the same way as in Poggi et al. (2010) [2]. To view the Rayleigh ellipticity curve:
$ gphistogram rtbf-3C.max -p R -ell-angle
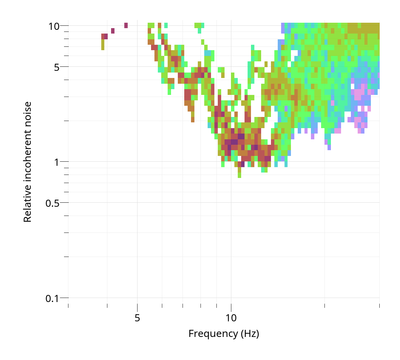
To view the ratio of incoherent over coherent noise:
$ gphistogram rtbf-3C.max -p R -noise
References
- ↑ Wathelet, M, Guillier, B, Roux, P, Cornou, C. and Ohrnberger, M., Rayleigh wave three-component beamforming: signed ellipticity assessment from high-resolution frequency-wavenumber processing of ambient vibration arrays, Geophysical Journal International, 215(1), 507-523.
- ↑ Poggi, V. and Fäh, D., 2010, Estimating Rayleigh wave particle motion from three-component array analysis of ambient vibrations, Geophysical Journal International, 180(1), 251–267
