H/V spectral ratio
This a short tutorial presenting a step-by-step H/V method procedure.
Contents
Introduction
The technique originally proposed by Nogoshi and Igarashi [1], and wide-spread by Nakamura[2], consists in estimating the ratio between the Fourier amplitude spectra of the horizontal (H) to vertical (V) components of ambient noise vibrations recorded at one single station.
This tool is used to obtain Horizontal to Vertical (H/V) spectral ratios from any type of vibration signals (ambient vibrations, earthquake…). The example used for explanations is an ambient vibration recording.
All parameters necessary to process signal data are set up in the Toolbox.
The reference document for the H/V processing is the SESAME user guidelines, which is strongly recommended for further reading [3].
Getting ready
- Download the compressed signal file.
- Load and view these downloaded signals.
- Select H/V spectral ratio in menu Tools (alternative ways to start a tool)
Window selection
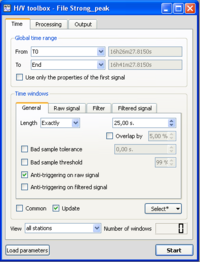
- Make sure that the H/V Toolbox is displaying the Time tab, and that parameters are set as in the example window.
- To ensure that parameters are alright, it is possible to download the tutorial parameter file and to load the toolbox parameters.
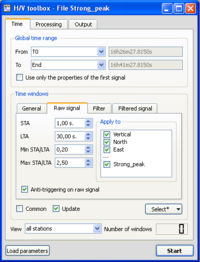
- Click on the Raw signal sub-tab in Time tab, to check that the anti-trigger parameters, used to get rid of saturated signal, are as in the example window.
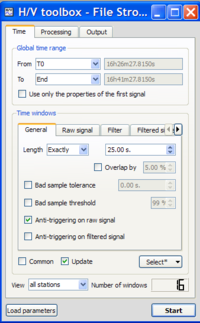
- Click on the Select button and select Auto.
- The number of selected windows appears at the bottom right corner of the Time tab.
The number of windows should be as in the example.
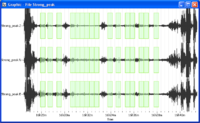
- Selected windows should appear as green rectangles on the Signal viewer.
- More options for selecting windows are available.
Processing parameters
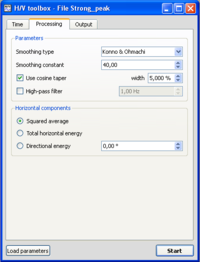
- Click on the Processing tab, and make sure that parameters are as in the example window.
Output parameters
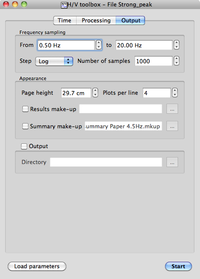
- Make sure that you are in the Output tab, and that parameters are as in the example window.
Data processing
- If no window selection has been performed, a pup-up window appears.
Simply click on the Yes button and processing will follow its way.
Results
Signal display
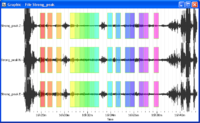
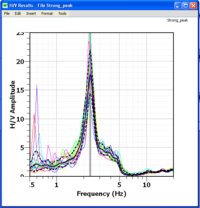
- Selected windows are colored, matching colours in he H/V graphics, i.e. colour of individual H/V curves have the same colour as the signal windows.
H/V curve
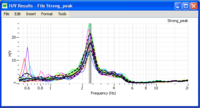
- The blak curve represents H/V geometrically averaged over all colored individual H/V curves The two dashed lines represent H/V standard deviation.
- The grey area represent the averaged peak frequency and its standard deviation. The frequency value is at the limit between the dark grey and light grey areas.
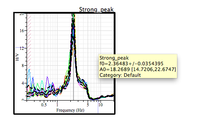
- Use the cursor to get values on the H/V curve. The exact value of the H/V peak frequency and its standard deviation may be obtained by sliding the cursor onto the H/V curve title (Strong_peak) in the upper right corner above the graphics.
Changing H/V graphics appearance
- It is possible to change the appearance of the H/V graphics at the user's will, using a make-up.
- As an example, first download the compressed make up file.
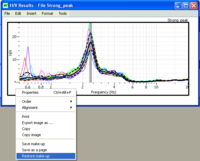
- Then right click in the left hand margin of the H/V graphics.
- Select Restore make-up in the pop-up menu and then select HV_Makeup.mkup file.
- The appearance of the H/V graphics is now at the user's taste.
Saving results
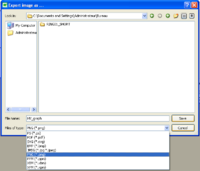
- The H/V graphics may be saved in various image formats.
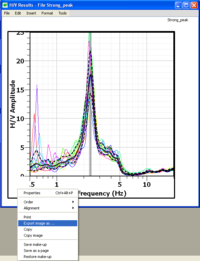
- Right click in the left hand margin of the H/V graphics.
- In the pop-up menu choose Export image.
- Choose a destination folder, image format, and file name.
References
- ↑ Nogoshi and Igarashi (1971)
- ↑ Nakamura, Y. (1989) A method for dynamic characteristics estimation of subsurface using microtremor on the ground surface. Quaterly Report of the Railway Technical Research Institue 30 (1), 25-30.
- ↑ Guidelines for the implementation of the H/V spectral ratio technique on ambient vibrations measurements, processing and interpretation, [1], 62 pages, April 2005

