Active source experiment (MASW)
General overview
First introduced by Al-Husseini et al. (1981), Mari (1984), Gabriels et al. (1987), the Multichannel analysis of surface waves was popularized by Park et al. (1999). This technique relies on the recording along a 1D linear profile of seismic signals produced by a controlled source (hammer, vibrator, explosion, etc.) and analysis of surface wave dispersion properties after applying slant-stack or FK transform to the recorded seismic section. In the following tutorial, only the FK transform is used.
Getting ready
- Download the compressed signal file.
- Launch Geopsy and set Rxxx as name in the Geopsy Loading Preferences.
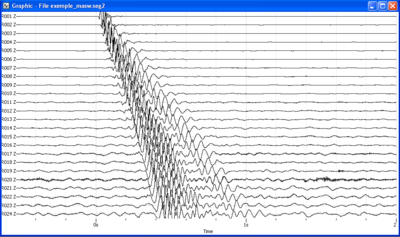
- Load and view these downloaded signals. A seismic section as the one displayed in the figure on the right should then appeared.
- Check in the Table signal viewer that sensors location is ranging from 0 to 92 meters with a 4 meters spacing.
- Check that source location is X=-4 meters by editing Set sources in Geopsy Edit menu. Alternatively, you can also add the Source X field in the Table signal viewer.
Description of the MASW toolbox
Open the MASW toolbox by pushing the following plugin icon ![]() or, alternatively, by selecting Linear F-K for active experiments in Tools menu.
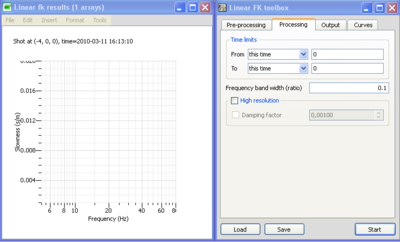
Two windows should then open as displayed in the figure on the right: the Linear FK toolbox to set up processing parameters and a Linear fk results to display MASW results. The Linear FK toolbox is composed of four tabs:
or, alternatively, by selecting Linear F-K for active experiments in Tools menu.
Two windows should then open as displayed in the figure on the right: the Linear FK toolbox to set up processing parameters and a Linear fk results to display MASW results. The Linear FK toolbox is composed of four tabs:
- Pre-processing tab is used to define the time window, the tapering, the amplitude normalization, etc.
- Processing tab allows to define the processing scheme (FK or HRFK)
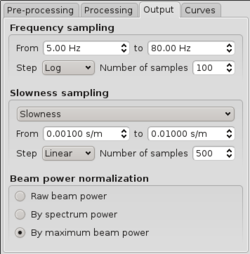
- Output tab is used to set up the frequency and slowness band to be processed and the output filename
- Time tab allows to select the time limits and part of the signals to be processed and the time window length;
- Curves tab is used to save, remove or load dispersion curves that are picked
Parameters setting
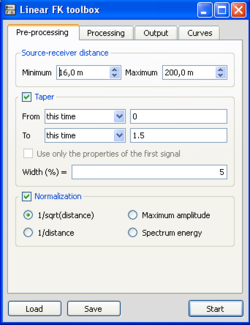
In Pre-processing tab:
- Select the minimum and maximum source-to-receiver distance which will be processed. This allows to exclude signals close to the source shot (this distance should be at least one wavelength in order to reduce near-field effects) or at large distances for which the signal-to-noise ratio may be low.
- Select the begin and end time window that will be considered during the processing. A taper is then applied to the selected time window.
- Specify the time limits to be processed. A taper is then applied to the selected time interval.
- Finally, by checking the Normalization check box, one can apply a normalization factor on the seismic traces. This normalization is especially usefull to reduce contribution in the f-k processing of large amplitude signals close to the source point. The normalization can depend on the distance offset along the profile (1/sqrt(distance) account for geometrical spreading of surface waves) or depend on the energy content of the signal: maximum amplitude and spectrum power allow normalizing by the maximum amplitude and maximum Fourier amplitude spectra, respectively.
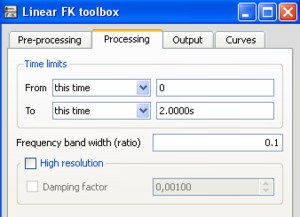
In Processing tab:
- Specify the time limits of the window length which will be used for FK processing: all samples out of the time window defined previously inthe Pre-processing tab will be set to 0.
- Specify the Frequency band width to be used in the computation of beampower spectra
- When checking the High Resolution box, one can also compute HRFK instead of FK. In such a case however, one has to specify a damping factor in order to stabilize the cross spectral matrix before inverting it. The optimum damping value is found by trial and error.
In Output tab:
- Specify the frequency band to be processed.
- Specify the phase slowness band to be processed. Note that you can also specify the phase velocities. However computation will be performed in the slowness domain.
- There are three options to normalize the beampower results: no normalization, normalization by the power spectra, normalization for each frequency by the maximum of the beampower.
