Difference between revisions of "H/V spectral ratio"
| Line 5: | Line 5: | ||
== Getting ready == | == Getting ready == | ||
| − | * Download [[Media: | + | * Download [[Media:Strong_peak.tgz|compressed signal file]]. |
* [[Loading and viewing signals|Load and view]] these downloaded signals. | * [[Loading and viewing signals|Load and view]] these downloaded signals. | ||
* Select ''H/V'' in menu [[Geopsy: Menu Tools|Tools]] ([[Geopsy: Tools|alternative ways]] to start a tool) | * Select ''H/V'' in menu [[Geopsy: Menu Tools|Tools]] ([[Geopsy: Tools|alternative ways]] to start a tool) | ||
| Line 12: | Line 12: | ||
[[Image:HV_toolbox_time.png|thumb|right|200px|Timing tab in toolbox]] | [[Image:HV_toolbox_time.png|thumb|right|200px|Timing tab in toolbox]] | ||
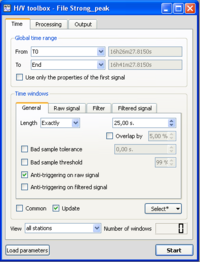
| − | * | + | * Make sure you are in the [[Geopsy: Toolbox_time_tab|Time tab]], and that parameters are as in the example window. |
| + | <br style="clear: both"/> | ||
| + | |||
| + | [[Image:HV_toolbox_time.png|thumb|right|200px|Timing tab in toolbox]] | ||
| + | * Click on the [[Geopsy: Toolbox_anti_trigger_tab|Raw signal]], to check that anti-trigger parameters are as in the example window. | ||
<br style="clear: both"/> | <br style="clear: both"/> | ||
[[Image:HV_toolbox_window_popup.png|thumb|right|200px|Select pop-up menu]] | [[Image:HV_toolbox_window_popup.png|thumb|right|200px|Select pop-up menu]] | ||
| − | * | + | * Click on the ''Select'' button and select Auto. |
<br style="clear: both"/> | <br style="clear: both"/> | ||
[[Image:HV_toolbox_window_time_postsel.png|thumb|right|200px|Number of selected windows]] | [[Image:HV_toolbox_window_time_postsel.png|thumb|right|200px|Number of selected windows]] | ||
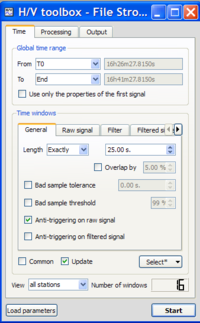
| − | * | + | * The number of selected windows appears at the bottom right corner of the time tab. |
The number of windows should be as in the example. | The number of windows should be as in the example. | ||
<br style="clear: both"/> | <br style="clear: both"/> | ||
| Line 28: | Line 32: | ||
<br style="clear: both"/> | <br style="clear: both"/> | ||
| − | == Processing | + | == Processing parameters == |
| + | |||
[[Image:HV_toolbox_process.png|thumb|right|200px|Processing tab in toolbox]] | [[Image:HV_toolbox_process.png|thumb|right|200px|Processing tab in toolbox]] | ||
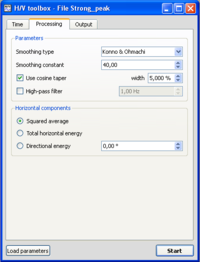
* Click on the [[Geopsy:Toolbox_processing|Processing tab]], and make sure that parameters are as in the example window. | * Click on the [[Geopsy:Toolbox_processing|Processing tab]], and make sure that parameters are as in the example window. | ||
| Line 34: | Line 39: | ||
== Output parameters == | == Output parameters == | ||
| + | |||
[[Image:HV_toolbox_output.png|thumb|right|200px|Output tab in toolbox]] | [[Image:HV_toolbox_output.png|thumb|right|200px|Output tab in toolbox]] | ||
| − | * | + | * Make sure you are in the [[Geopsy:Toolbox_output|Output tab]], and that parameters are as in the example window. |
<br style="clear: both"/> | <br style="clear: both"/> | ||
| − | == | + | == Data processing == |
| − | * | + | |
| + | * Click on Start button at the bottom of the toolbox, whatever tab is displayed. [[Image:HV_toolbox_star.png]] | ||
<br style="clear: both"/> | <br style="clear: both"/> | ||
| Line 46: | Line 53: | ||
Simply click on the Yes button and processing will follow its way. | Simply click on the Yes button and processing will follow its way. | ||
| + | <br style="clear: both"/> | ||
| + | |||
| + | == Results == | ||
| + | |||
| + | ==== Signal diplay ==== | ||
| + | [[Image:HV_toolbox_time.png|thumb|right|200px|Timing tab in toolbox]] | ||
| + | * Selected windows are colored, matching colours in he H/V graphics, i.e. colour of indidual H/V curves have he same colour as the signal windows. | ||
| + | <br style="clear: both"/> | ||
| + | ==== H/V curve ==== | ||
| + | [[Image:HV_toolbox_time.png|thumb|right|200px|Timing tab in toolbox]] | ||
| + | * The blak curve represents H/V averaged over all colored individual H/V curves The two dashed lines represent H/V standard deviation. | ||
| + | * The grey area represent the peak requency and its standard deviation. The frequency value is at the limit betwen the dark and clear areas. | ||
| + | <br style="clear: both"/> | ||
| + | * Use the cursor to get values on the H/V curve. The exact value of the frequny of he H/V peak and its standard deviation may be obtined y sliding the rsor no he H/V curve title. | ||
<br style="clear: both"/> | <br style="clear: both"/> | ||
Revision as of 07:48, 9 March 2010
This tool is used to obtain Horizontal to Vertical (H/V) spectral ratios from any type of vibration signals (ambient vibrations, earthquake…). The example used for explanations is an ambient vibration recording.
Contents
Getting ready
- Download compressed signal file.
- Load and view these downloaded signals.
- Select H/V in menu Tools (alternative ways to start a tool)
Window selection
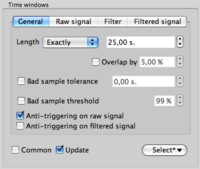
- Make sure you are in the Time tab, and that parameters are as in the example window.
- Click on the Raw signal, to check that anti-trigger parameters are as in the example window.
- Click on the Select button and select Auto.
- The number of selected windows appears at the bottom right corner of the time tab.
The number of windows should be as in the example.
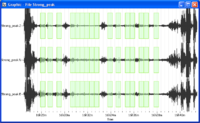
- Selected windows should appear as green rectangles on the signal viewer.
Processing parameters
- Click on the Processing tab, and make sure that parameters are as in the example window.
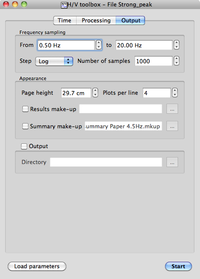
Output parameters
- Make sure you are in the Output tab, and that parameters are as in the example window.
Data processing
- In case no window selection has been performed, a pup-up window appears.
Simply click on the Yes button and processing will follow its way.
Results
Signal diplay
- Selected windows are colored, matching colours in he H/V graphics, i.e. colour of indidual H/V curves have he same colour as the signal windows.
H/V curve
- The blak curve represents H/V averaged over all colored individual H/V curves The two dashed lines represent H/V standard deviation.
- The grey area represent the peak requency and its standard deviation. The frequency value is at the limit betwen the dark and clear areas.
- Use the cursor to get values on the H/V curve. The exact value of the frequny of he H/V peak and its standard deviation may be obtined y sliding the rsor no he H/V curve title.
The toolbox may be opened in two different ways:
- if the signal window is already open clik on the H/V icon

- if the signal window is not open drag the file(s) from the file manager to the H/V icon

The toolbox shows up in the form it was previously closed, with the file name(s) in the header.
The toolbox contains set ups for windowing selection and processing, together with output parameters.
Time tab
Divided into three parts
Global time range
Used to select all or part of the signal to be processed.
Works like the Waveform/Cut basic signal processing under the Waveform menu.
When "Use only the properties of the first signal" is checked, all tracks use the time parameters (T0, End, Picks) of the top track.
Time windows
Windowing results
Below Time windows a line gives the resulting selected windows, in all stations, with possibility to get the number of windows in each station through the View pop-up menu.
