Difference between revisions of "Spectral amplitudes"
Jump to navigation
Jump to search
| Line 5: | Line 5: | ||
== Getting ready == | == Getting ready == | ||
| − | * Download [[Media:Strong_peak.tgz|compressed signal file]]. If the file has been already downloaded, do not download it again. | + | * Download [[Media:Strong_peak.tgz|compressed signal file]]. If the file has been already downloaded (as for H/V purposes for example), do not download it again. |
* [[Loading and viewing signals|Load and view]] these downloaded signals. | * [[Loading and viewing signals|Load and view]] these downloaded signals. | ||
* Select ''Spectrum'' in menu [[Geopsy: Menu Tools|Tools]] ([[Geopsy: Tools|alternative ways]] to start a tool) | * Select ''Spectrum'' in menu [[Geopsy: Menu Tools|Tools]] ([[Geopsy: Tools|alternative ways]] to start a tool) | ||
Revision as of 11:51, 9 March 2010
This tool is used to obtain spectral amplitude from any type of vibration signals (ambient vibrations, earthquake…). The example used for explanations is an ambient vibration recording.
Contents
Getting ready
- Download compressed signal file. If the file has been already downloaded (as for H/V purposes for example), do not download it again.
- Load and view these downloaded signals.
- Select Spectrum in menu Tools (alternative ways to start a tool)
Window selection
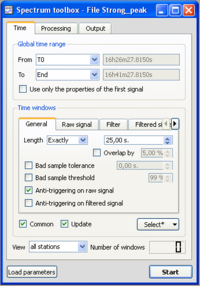
- Make sure you are in the Time tab, and that parameters are as in the example window. The Anti-triggering on raw signal button has been checked.
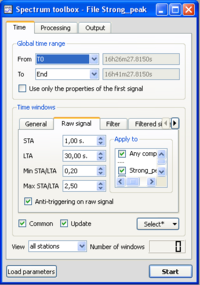
- Click on the Raw signal, to check that anti-trigger parameters are as in the example window. As we want the same windowing as in the H/V processing, the Common button should be checked.
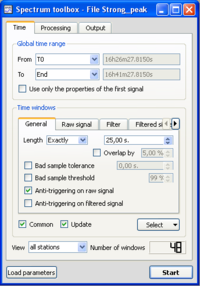
- Click on the Select button and select Auto into the pop-up menu.
- The number of selected windows appears at the bottom right corner of the time tab. The number of windows should be as in the example.
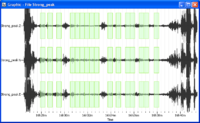
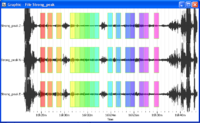
- Selected windows should appear as green rectangles on the signal viewer. Here, the windows are synchronous on the three components as we required a common windowing.
Processing parameters
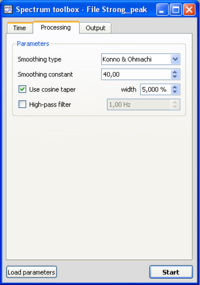
- Click on the Processing tab, and make sure that parameters are as in the example window.
Output parameters
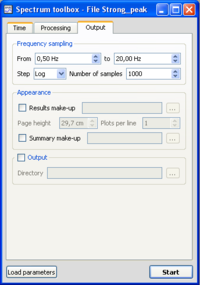
- Make sure you are in the Output tab, and that parameters are as in the example window.
Data processing
- In case no window selection has been performed, a pup-up window appears.
Simply click on the Yes button and processing will follow its way.
Results
Signal display
- Selected windows are colored, matching colours in the spectrum graphics, i.e. colour of individual spectrum curves have the same colour as the signal windows.
Spectrum curves
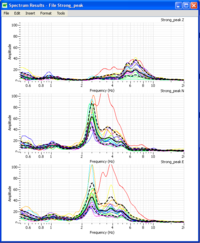
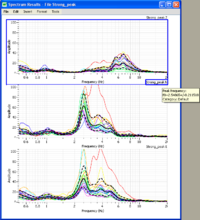
- As the spectrum has been computed on each components, the results are displayed for each component. So the graph is divided in three different curves.
- In each graph, the black curve represents the spectrum averaged curve over all colored individual spectrum curves The two dashed lines represent spectrum standard deviation.
- The greyed areas represent the frequency peak and its standard deviation. The frequency value is at the limit between the dark and clear areas.
- Use the cursor to get values on the spectrum curves. The exact value of the spectrum peak frequency and its standard deviation may be obtained by sliding the cursor onto the spectrum curve title (Strong_peak Z, Strong_peak N, Strong_peak E) in the upper right corner above the graphics.
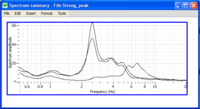
- For the spectrum computation, a synthetic graph displays the averaged spectrum curves coming from each waveform.
