Difference between revisions of "H/V spectral ratio"
Jump to navigation
Jump to search
| Line 69: | Line 69: | ||
<br style="clear: both"/> | <br style="clear: both"/> | ||
| − | == Changing H/V graphics | + | == Changing H/V graphics appearance == |
| − | [[Image:HV_toolbox_makeup.png|thumb|right|200px|H/V graphics aspect change obtained by applying a make up]] | + | [[Image:HV_toolbox_makeup.png|thumb|right|200px|H/V graphics aspect change obtained by applying a make-up]] |
| − | * It is possible to change the | + | * It is possible to change the appearance of the H/V graphics using a make-up. |
| − | * To do so, first download [[Media:HV_make_up.tgz|compressed make up file]]. | + | * To do so, first download the [[Media:HV_make_up.tgz|compressed make up file]]. |
| − | * Then open [[Geopsy: Menu Tools| | + | * Then open the [[Geopsy: Menu Tools Output|Output tab]] in the [[Geopsy: Toolbox|Toolbox]] |
| + | * Check the ''Results'' [[Geopsy: Output make-up|''make-up'']] box and browse to find the | ||
| + | [[Image:HV_toolbox_makeup.png|thumb|right|200px|H/V graphics aspect change obtained by applying a make-up]] | ||
<br style="clear: both"/> | <br style="clear: both"/> | ||
Revision as of 09:36, 9 March 2010
This tool is used to obtain Horizontal to Vertical (H/V) spectral ratios from any type of vibration signals (ambient vibrations, earthquake…). The example used for explanations is an ambient vibration recording.
Contents
Getting ready
- Download compressed signal file.
- Load and view these downloaded signals.
- Select H/V in menu Tools (alternative ways to start a tool)
Window selection
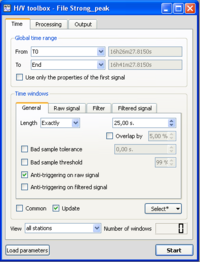
- Make sure you are in the Time tab, and that parameters are as in the example window.
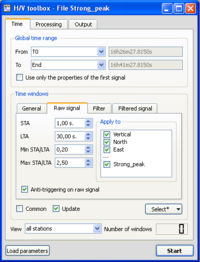
- Click on the Raw signal, to check that anti-trigger parameters are as in the example window.
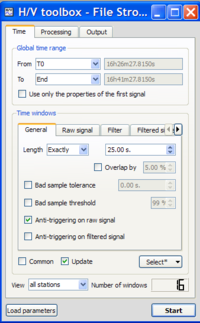
- Click on the Select button and select Auto.
- The number of selected windows appears at the bottom right corner of the time tab.
The number of windows should be as in the example.
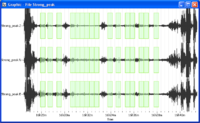
- Selected windows should appear as green rectangles on the signal viewer.
Processing parameters
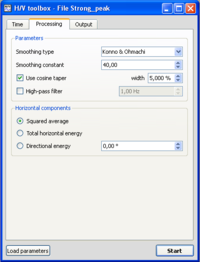
- Click on the Processing tab, and make sure that parameters are as in the example window.
Output parameters
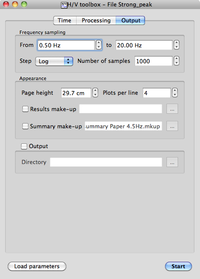
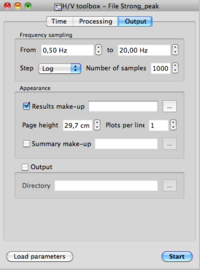
- Make sure you are in the Output tab, and that parameters are as in the example window.
Data processing
- In case no window selection has been performed, a pup-up window appears.
Simply click on the Yes button and processing will follow its way.
Results
Signal diplay
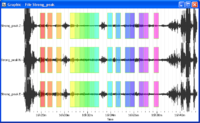
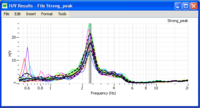
- Selected windows are colored, matching colours in he H/V graphics, i.e. colour of individual H/V curves have the same colour as the signal windows.
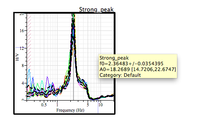
H/V curve
- The blak curve represents H/V averaged over all colored individual H/V curves The two dashed lines represent H/V standard deviation.
- The grey area represent the peak frequency and its standard deviation. The frequency value is at the limit between the dark and clear areas.
* Use the cursor to get values on the H/V curve. The exact value of the H/V peak frequency and its standard deviation may be obtained by sliding the cursor onto the H/V curve title (Strong_peak) in the upper right corner above the graphics.
Changing H/V graphics appearance
- It is possible to change the appearance of the H/V graphics using a make-up.
- To do so, first download the compressed make up file.
- Then open the Output tab in the Toolbox
- Check the Results make-up box and browse to find the
Saving results
Further readings
- Guillier et al. 1998,1999,2002,2003, 2004, 2005a, 2005b, 2005c, 2005d, 2007, 2008, 2009, 2010, 2011
- Chatelain et al. 1985, 1987, 1998,1999,2002,2003a, 2004, 2008a, 2008b, 2009, 2010, 2011, 2012a, 2012b
- Spectral ratios along a profile
