Difference between revisions of "Geopsy: Graphic"
| Line 56: | Line 56: | ||
| − | |||
In the '''Y Axis Box''' one of the following option can be chosen: | In the '''Y Axis Box''' one of the following option can be chosen: | ||
| − | * | + | *''Signal index'' is the default option for the baseline. |
| − | * | + | *''Projection of receivers coordinates''. An horizontal line is automatically adjusted to the receiver X,Y coordinates with a least square method. The receivers coordinates are then projected on to this line to calculate distances along this line. The scale of the Y axis is the distance along this line. |
| − | * | + | *''Station names'' is the same as "Signal index" except that it gives the names of the station at the end of the baseline. |
| − | * | + | *''Overlayed'' plots all the signals on the same baseline. |
| + | |||
In the '''Time range Box''' one of the following options can be chosen: | In the '''Time range Box''' one of the following options can be chosen: | ||
| − | * | + | *''Available range'' displays the whole available time range |
| − | * | + | *''Around a pick'' TO COMPLETE |
| − | * | + | *''Custom range'' TO COMPLETE |
%%%KEEP THAT ? | %%%KEEP THAT ? | ||
Revision as of 16:50, 11 March 2010
A Graphic is a graph Signal viewer representing the data of a set or a subset of signals, either time histories, Fourier Transform amplitudes or Fourier Transform phases (refer to Geopsy: Fast Fourier Transform). It can be created using the View menu and then drag & drop the set of signals of interest in the graphic viewer. Drag & drop signals directly on the graphic icon ![]() in the toolbar produces the same.
in the toolbar produces the same.
The various actions that can be performed with a subset of signals in a graphic are described in Signal viewer entry.
Contents
Appearance
The graphic viewer makes use of a general graph object from the SciFigs library allowing to customize and save the figure.
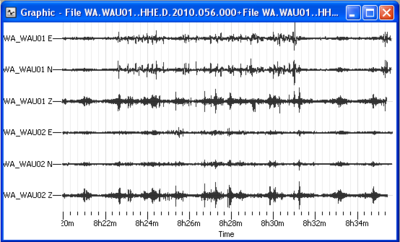
When only one signal is represented, the Y scale is the signal amplitude (count or volts). When various signals are shown, the Y scale ranges from 0.5 to n+0.5 where n is the number of signals. The axis label are generally replaced by the names of signals suffixed by the signal's component. The baseline (reference line with a null amplitude) of each signal is located at y=1, 2,..., n. The signals are drawn around their baseline. The maximum amplitude around this baseline is adjusted by the normalisation parameters described hereafter.
Layers in a Graphic viewer
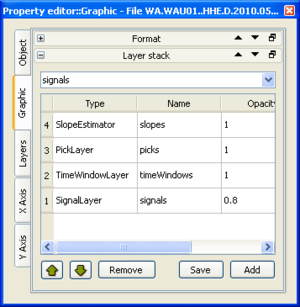
A graphic viewer is a superposition of 4 layers. They can be seen and modified by double-clicking on the graphic or right-clicking and choosing Properties, in the Graphic tab, box Layer stack.
- Layer 1 is a signal Layer described in the following section
- Layer 2 is the Time window layer used by the tools
- Layer 3 is a Pick layer including the manual time picks described in a following section
- Layer 4 is the Slope estimator layer including the hodochrones described in a following section.
The signal layer
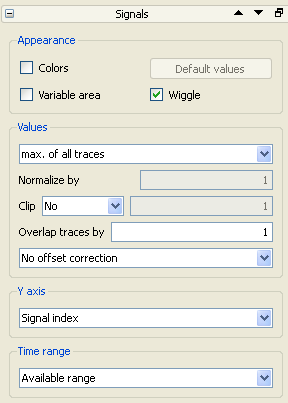
Signals are plotted in a special type of layer developed especially for Geopsy. The parameters to customize are accessed by double-clicking on the graphic or right-clicking and choosing Properties. In the Layers tab, the first box entitled Signals contains the parameters linked to the signal layer.
In the Appearance Box the following options can be checked:
- Colors: the amplitude of the signals is represented with a colour scale. This mode of representation has some constraint: the sampling frequency of all signals must be the same and the differences of T0 must a multiple of the sampling period. This mode is generally reserved for reflection data (radar or seismic).
- Variable area: the positive areas are coloured in black.
- Wiggle: if selected, the signal is drawn as a solid line
In the Values Box the following parameters are available:
- Normalize by. Maxima are calculated on each signal by one of the proposed methods in a first step:
- max of all traces: a unique maximum is the maximum of the maxima found on each trace.
- max of each trace: the maxima are the maxima found on each trace. The normalisation varies from one trace to another.
- visible max of all traces: a unique maximum is the maximum of the maxima found on the currently visible part of each trace.
- visible max of each trace: the maxima are the maxima found on the currently visible part of each trace. The normalisation varies from one trace to another.
- specified value: an arbitrary value can be specified in the underlying text box.
- Clip: in a second step, a clip value is calculated (as a function of the maximum or the maxima if "percentage" is selected). If each trace is selected in the normalisation, the clip value may change from one trace to another.
- no: the clip value is the maximum or the maxima, no visualisation clip effect.
- value: an arbitrary value can be fixed.
- percentage: the clip value is set as a percentage of the maximum or the maxima.
- Overlap: in a third step, the time dependent offsets from the signal baseline are calculated. These offsets are equal to the half of the overlap value (no division by 2 for frequency spectra) if the amplitude of the signal is equal to the maximum of the considered signal (case of each trace normalisation). An overlap of 1 ensures that the signals will never overlap.
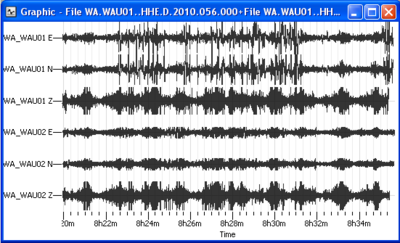
The procedure remains valid when only one signal is plotted, except that max of each or max of all have no effects. An example of signals normalised by visible max of each trace, clipped at 25%, and with an overlap of 4 is given on the right.
In the Y Axis Box one of the following option can be chosen:
- Signal index is the default option for the baseline.
- Projection of receivers coordinates. An horizontal line is automatically adjusted to the receiver X,Y coordinates with a least square method. The receivers coordinates are then projected on to this line to calculate distances along this line. The scale of the Y axis is the distance along this line.
- Station names is the same as "Signal index" except that it gives the names of the station at the end of the baseline.
- Overlayed plots all the signals on the same baseline.
In the Time range Box one of the following options can be chosen:
- Available range displays the whole available time range
- Around a pick TO COMPLETE
- Custom range TO COMPLETE
%%%KEEP THAT ? For colour representation of signals, the values of the colour palette can be adjusted by clicking on "Default values for colour palette". The normalisation and the clipping settings are taken into account.
The display settings are saved in file "$HOME/.qt/geopsyrc" under the rubric "DialogOptions", entries "Signalgcprop/*" (for Linux users). For Windows users, this information is located in the registry (regedt32). The settings are automatically saved when the properties of the graphic's contents are edited. The saved settings are restored only each time a new graphic viewer is created.%%%
Time Picking
Picks are time markers that you can use to identify particular times and/or phases (e.g. Vp arrivals for refraction, time limits for signal processing such as a time domain taper). By default picks appear as thick blue vertical lines in the time line of the traces.
For that purpose, right-click on the graphic viewer and select "Pick". A dialog box appears with the picking options:
- "Use pick n" allows to select marker set. Marker sets are distinguished by a number from 0 up to 1000.
- "Magnifier window" displays an additional graphic viewer during the picking with a zoomed time scale around the pick. It is a usual graphic viewer, with a vertical line to mark the current position of the mouse (created with ParallelBands layer, hence you can hide it if you want). All the common properties of a graphic viewer may be changed, for instance to enlarge the time interval or to fix the Y scale. The X interval is kept constant as the mouse moves. The following options can precise the parameters of this window:
- "Size of context": defines the number of traces visible above and below the selected one
- "Display time": defines the time interval of the magnified time window
It is not possible to pick in the Magnifier window.
The active trace is highlighted in red and the current marker set number is displayed in the bottom right corner. If "Picking disabled" is displayed, it is likely that you are in "Zooming" or "Editing" mode (displayed in bottom left corner). In this case, the clicks will not have any effects. First you have to quit this mode by hitting CTRL+SHIFT+z or by selecting "Zoom" in the context menu (figure 2(b)). Once "Setting pick n" is displayed, any click on the mouse left button will modify the value of the current pick. Use the "Up" and "Down" arrows to change the active signal, "Left" and "Right" arrows to switch between marker sets. If hitting those keys has no effect, check that the main graphic viewer is active, if not, click in its title bar (this is frequently the case when a magnifier is used).
You can select the visible time picks as well as their colors with the Box "Pick" in the tab "Layer" of graphic properties (figure 4). These parameters are saved and restored in the same way as other settings.
Figure 4: Signal picks, visibility and colours.
You can modify picks in a table by editing the corresponding fields. However, it is usually edited in a graphic viewer with mouse clicks. As shown in figure 2(b), select menu "Pick" from the graphic's contents menu. You will be prompted to select one of the ten picks to edit.
%%%KEEP IT ?
Y axis: zoom blocked
By default, the minimum and the maximum visible limits of the Y axis are fixed. You cannot change them with the zoom (figure 2(b)). You can still change them by editing the axis properties (min and max). The blocked zoom lets zoom in the signals with a rectangle which Y limits are ignored. Only the X interval (the time or the frequency) is taken into account. You can unlock this feature by unchecking the option "Zoom blocked" in tab "General" of the Y axis properties dialog box. This feature may be manually set for X axis but it is less useful.
%%%
Hodochrones
Signal selection
Contrary to tables, it is not possible to select particular signals in a graphic viewer. The drag and drop mechanism works in a similar way but all the signals are considered rather than a selection. Graphic viewers also accept drops of signals that are added at the end.


