Difference between revisions of "Active source experiment (MASW)"
Jump to navigation
Jump to search
| Line 11: | Line 11: | ||
* Launch [[Geopsy|Geopsy]] and set ''Rxxx'' as name in the [[Geopsy:_Preferences| Geopsy Loading Preferences]]. | * Launch [[Geopsy|Geopsy]] and set ''Rxxx'' as name in the [[Geopsy:_Preferences| Geopsy Loading Preferences]]. | ||
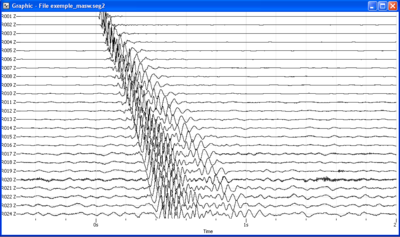
* [[Loading and viewing signals|Load and view]] these downloaded signals. A seismic section as the one displayed in the figure on the right should then appeared. | * [[Loading and viewing signals|Load and view]] these downloaded signals. A seismic section as the one displayed in the figure on the right should then appeared. | ||
| − | |||
* Check in the [[Geopsy:_Table| Table signal viewer]] that sensors location is ranging from 0 to 92 meters with a 4 meters spacing. | * Check in the [[Geopsy:_Table| Table signal viewer]] that sensors location is ranging from 0 to 92 meters with a 4 meters spacing. | ||
* Check that source location is X=-4 meters by editing ''Set sources'' in [[Geopsy:_Edit_menu|Geopsy Edit]] menu. Alternatively, you can also add the ''Source X'' field in the [[Geopsy:_Table|Table signal viewer]]. | * Check that source location is X=-4 meters by editing ''Set sources'' in [[Geopsy:_Edit_menu|Geopsy Edit]] menu. Alternatively, you can also add the ''Source X'' field in the [[Geopsy:_Table|Table signal viewer]]. | ||
| Line 17: | Line 16: | ||
<br style="clear: both"/> | <br style="clear: both"/> | ||
| − | |||
| − | |||
| − | |||
| − | |||
===Description of the MASW toolbox === | ===Description of the MASW toolbox === | ||
| + | * Open the MASW toolbox by pushing the following plugin icon [[Image:MASWToolboxPluginIcon.png|30px]] or, alternatively, by selecting ''Linear F-K for active experiments'' in [[Geopsy: Tools|''Tools'']] menu. | ||
* difference entre taper et processing window | * difference entre taper et processing window | ||
* HRFK (cross-link avec HRFK de Mathias) | * HRFK (cross-link avec HRFK de Mathias) | ||
Revision as of 15:13, 11 March 2010
General overview
First introduced by Al-Husseini et al. (1981), Mari (1984), Gabrielset al. (1987), the Multichannel analysis of surface waves was popularized by Park et al. (1999). This technique relies on the recording along a 1D linear profile of seismic signals produced by a controlled source (hammer, vibrator, explosion, etc.) and analysis of surface wave dispersion properties after applying slant-stack or FK transform to the recorded seismic section. In the following tutorial, only the FK transform is used.
Getting ready
- Download the compressed signal file.
- Launch Geopsy and set Rxxx as name in the Geopsy Loading Preferences.
- Load and view these downloaded signals. A seismic section as the one displayed in the figure on the right should then appeared.
- Check in the Table signal viewer that sensors location is ranging from 0 to 92 meters with a 4 meters spacing.
- Check that source location is X=-4 meters by editing Set sources in Geopsy Edit menu. Alternatively, you can also add the Source X field in the Table signal viewer.
Description of the MASW toolbox
- Open the MASW toolbox by pushing the following plugin icon
 or, alternatively, by selecting Linear F-K for active experiments in Tools menu.
 - difference entre taper et processing window
- HRFK (cross-link avec HRFK de Mathias)
- normalize energy
FK Computing
- computation for one single file and picking of the curve
- alternatives : 1) create a stack file and then compute the FK; 2)compute FK for all shots and then stack the FK maps
