Difference between revisions of "Geopsy: Chronogram"
Jump to navigation
Jump to search
(New page: Chronogram is a Signal Viewer in which it is possible to display the available time-series. In order to display files in the chronogram viewer you can simply [[Ge...) |
|||
| (One intermediate revision by the same user not shown) | |||
| Line 1: | Line 1: | ||
| − | |||
| − | |||
| − | |||
| − | |||
| − | |||
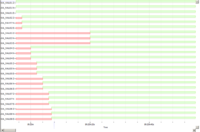
[[Image:ChronogramViewer.png|thumb|right|200px|Chronogram view]] | [[Image:ChronogramViewer.png|thumb|right|200px|Chronogram view]] | ||
| − | + | ||
| + | Chronogram is a [[Geopsy: Signal Viewer|Signal Viewer]] in which it is possible to display the availability of time-series without loading the actual values of signals (much faster to plot than [[Geopsy: Graphic|graphic viewer]] for long time series). | ||
| + | In order to display signals in the chronogram viewer you can simply [[Geopsy: Signal drag&drop|drag and drop]] signals on the corresponding Chronogram icon [[Image:IconChronogram.png|middle]]. Traces are not displayed as waveforms but as boxes of different color: | ||
| + | * Green: available signal | ||
| + | * Red: missing samples | ||
| + | * Blue: overlapping time blocks | ||
| + | |||
| + | These color are set by default and cannot be changed. Signals are grouped by [[Geopsy: Database#Name|station name]] and [[Geopsy: Database#Component|component]] on the same base line. | ||
Latest revision as of 16:35, 11 March 2010
Chronogram is a Signal Viewer in which it is possible to display the availability of time-series without loading the actual values of signals (much faster to plot than graphic viewer for long time series).
In order to display signals in the chronogram viewer you can simply drag and drop signals on the corresponding Chronogram icon ![]() . Traces are not displayed as waveforms but as boxes of different color:
. Traces are not displayed as waveforms but as boxes of different color:
- Green: available signal
- Red: missing samples
- Blue: overlapping time blocks
These color are set by default and cannot be changed. Signals are grouped by station name and component on the same base line.
