Geopsy: H/V and Spectrum Results
Windowing and processing have been performed after adjusting parameters in the H/V Toolbox.
Contents
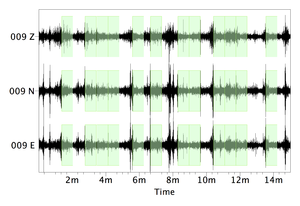
Signal and selected windows
After applying the windowing selection criteria, the selected windows appear in green on the signal sheet.
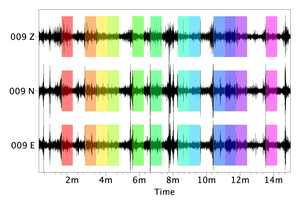
After processing, each selected windows appear with its own color on the signal sheet.
H/V graph
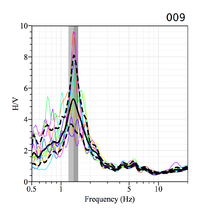
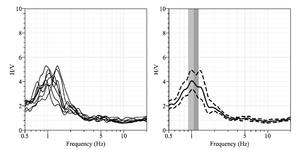
The H/V graph shows:
- individual H/V curves from the selected windows, with the color of the corresponding window in the signal sheet (provided All window of the H/V options in preferences has been selected
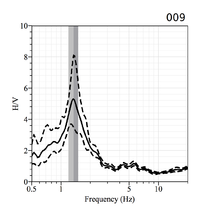
- the average H/V curve (black line)
- the amplitude standard deviation curves (dashed lines)
- the H/V peak frequency standard deviation domains (the two vertical gray areas)
The frequency of the H/V peak is at the limit between the two gray areas.
The name of the receiver appear above the top right corner of the H/V graph.
If All window of the H/V options in preferences has not been selected the color curves do not appear
H/V graph tools
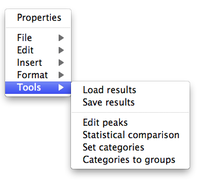
With a right-click outside the H/V graph a menu appears (this menu is also present at the top of the window when running geopsy under Windows or Linux).
The menu items are described in the figue reference manual, except Tools, which is a geopsy specific feature described here below.
Item Tools
- Load results
- Save results
- Edit peaks
- Statistical comparison
- Set categories
- Categories to group
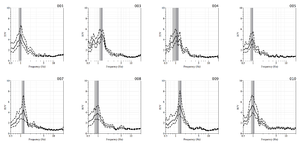
Processing several receivers
Individual H/V curves
H/V summary
