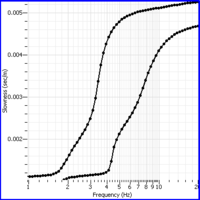
SciFigs: Graph
A Graph can be any representation of one or a series of groups that represent an X, Y set of data with or withought their Standard Deviation.
By Double Clicking on the window or going to the left right corner of the box - outside the XY plot but inside the Graph, pressing the right button and selecting Properties, the user have the possibility to access and define the properties of the XY plot and the Graph.
From the Properties Window you can define X axis, Yaxis, Graphic and Layers.
X axis
The user can set from the Range Box the Minimum and the Maximum Range based on Data Limits ![]() or on current visible maxim (makes sense only if you have zoomed in an area)
or on current visible maxim (makes sense only if you have zoomed in an area) ![]() . In the Ticks box you can define the Major and Minor Ticks and if you want them to be set up automatically, to be labeled (it corresponds to Major Ticks) and also if you will allow to zoom for this Axis, by checking (default) or un-checking the corresponding check-boxes.
. In the Ticks box you can define the Major and Minor Ticks and if you want them to be set up automatically, to be labeled (it corresponds to Major Ticks) and also if you will allow to zoom for this Axis, by checking (default) or un-checking the corresponding check-boxes.
Y axis
Graphic
Layers

