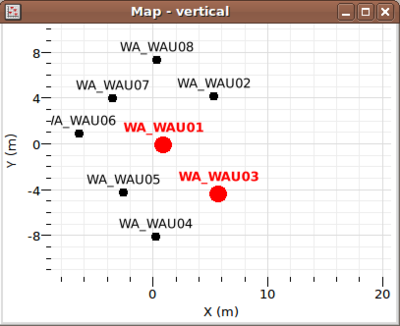
Geopsy: Map
A Map is a Signal viewer two-dimensional representation of receivers coordinates in the XY plane for a set or a subset of signals. It can be created using the View menu and then drag and drop the set of signals of interest in the graphic viewer. Drag and drop signals directly on the graphic icon in the toolbar produces the same.
The geographical coordinates of the receivers are set using the Edit menu
The various actions that can be performed with a subset of signals in a map are described in Signal viewer entry.
A map makes use of the general XY plot object from the Scifigs library. The area of a map is partitioned in the same way as a graphic viewer. The main layer is a XYNamePlot which means that signals (or stations) are represented by configurable symbols (shape, size, color, ...) and by their names the relative positions of which can be adjusted (top, left, right, bottom, distance). To create plots suitable for publication, you can save the XY plot to a page file and customize the presentation into figue.
Map scale
Scales of maps are intrinsic properties of XY plot objects. Some tips are given here.
%%% Both X and Y axis have by default the same scale. The scale is automatically adjusted so that all the receiver coordinates of the signals contained in the viewer remain visible. Resizing the viewer has no effect on the scale, it changes only the axis minimum and maximum values. To change the scale, edit the axis properties by double-click or context menus, tab Geometry. Modify the scale (e.g. 400, for 1cm = 4m). Make sure the scales are the same for X and Y axis to avoid distortions. Alternatively, you can resize the map viewer (this saves the size to the user settings). Then create a new viewer with the drag and drop mechanism (or redo the what you did to create the present one):
Select all signals (see hereafter); Leave the editing mode; Press the mouse left button and move the pointer to the map icon (); Release the mouse button. %%%
Signal selection
Apart from the visualisation, maps offer the advantage over tables that you can select station according to their localisations. In the active map, right-click on the mouse to activate the context menu, select "Select stations". The object switch to the selecting mode ("Select stations" is checked) (see figure 1). When you press and move the mouse in this mode, a dotted rectangle is displayed. When releasing the mouse, all coordinates that fall within this rectangle are selected (marked as bold and red), others are unselected. To select more signals, press SHIFT. To leave the the "Select stations" mode hit CTRL+SHIFT+e (CMD+SHIFT+e for Mac) or unselect "Select stations" by right-click again. If several signals have the same coordinates they are indistinctively selected together.
The drag and drop mechanism is deactivated when the "Zooming" or the "Select stations" mode is switched on. To move the selected signals to another viewer, first leave these modes.
