SciFigs: Legend
A legend is a graphical object that can be inserted in a graphic sheet. A legend is a description of various line, symbol and text attributes used for plotting curves on a XY plot containing line layers.
Contents
Creating a new legend
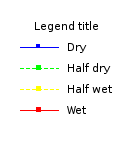
In a graphic sheet such as figue, select menu Insert/Legend. Alternatively, use the toolbar icon for legend ![]() or right-click on a blank part of the graphic sheet and access all menu items through the context menu (useful for Mac users who have no top menu bar when the graphic sheet is embedded in a larger application, e.g. inside geopsy). Open this page file in figue to plot the same legend as in figure.
or right-click on a blank part of the graphic sheet and access all menu items through the context menu (useful for Mac users who have no top menu bar when the graphic sheet is embedded in a larger application, e.g. inside geopsy). Open this page file in figue to plot the same legend as in figure.
Editing and Exporting/Importing a legend
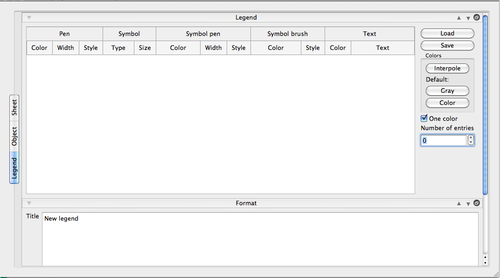
By double clicking on the graph of the legend you get the properties window of the legend box. You can than specify the properties of Pen, Symbol, Symbol pen, Symbol brush, and the Text to describe different lines.
The user has the ability to Import, Load,' or Export, Save', the Legend information from or into a file. This is very useful when one is using command line tools and he wants directly to use a Legend file (.legend).
Additionally one can decide to use colors as these is a result of an Interpole  between two colors from the list of colors already used. Also an automatic way to directly use color
 ![]() or
or ![]() gray scale by pressing the
gray scale by pressing the ![]() or the
or the ![]() Button in Colors frame. Finally the user has the possibility to use different colors for the Pen, Symbol Pen, Symbol Brush and Text for the same curve. In order to do that one should un-check the box One color below the Colors frame. The user can increase or decrease the number of entries in the Legend Graph when he is using the Legend from
Button in Colors frame. Finally the user has the possibility to use different colors for the Pen, Symbol Pen, Symbol Brush and Text for the same curve. In order to do that one should un-check the box One color below the Colors frame. The user can increase or decrease the number of entries in the Legend Graph when he is using the Legend from
Pen
You can select the Pen Color (shown on the left side figure), the Width ![]() and the Style
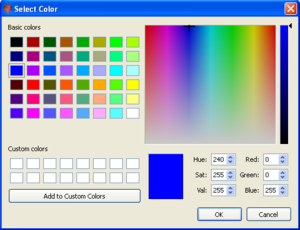
and the Style ![]() , as Continous, Dashed or Dotted line. Especially for the Color Selection the user can select one of the Basic colors already defined or create his own color and add it to the Custom Colors by either pressing the appropriate button
, as Continous, Dashed or Dotted line. Especially for the Color Selection the user can select one of the Basic colors already defined or create his own color and add it to the Custom Colors by either pressing the appropriate button ![]() or drag & drop it to the list of Custom Colors.
or drag & drop it to the list of Custom Colors.
Symbol
The user can define here the Type of Symbol ![]() that could be an x, a rectangular, a circle, a triangle, a diamond or a star. Additionally one can specify and the Size of the Symbol.
that could be an x, a rectangular, a circle, a triangle, a diamond or a star. Additionally one can specify and the Size of the Symbol.
Symbol pen
The user can define here the parameters for the pen that creates the Symbol to be used, as the Color, the Width and the Style.
Symbol brush
The user can define the Color and the Style ![]() to be used.
to be used.
Text
The user can define the Text to be used at the legend box describing each curve. It is also possible to define the color of the text.


