Difference between revisions of "Ambient vibration array"
| Line 32: | Line 32: | ||
group directly into the f-k toolbox icon. Geopsy will automatically open a new exclusively attached signal viewer | group directly into the f-k toolbox icon. Geopsy will automatically open a new exclusively attached signal viewer | ||
for you. | for you. | ||
| + | |||
| + | <br style="clear: both"/> | ||
| + | |||
| + | Let's now have a close look to the individual parameters to be set in the f-k toolbox. There are four | ||
| + | main groups of parameters to be considered. | ||
| + | |||
| + | * Pre-processing parameters for excluding data from processing. | ||
| + | * Processing parameters for selecting time windows on the remaining data. | ||
| + | * Processing parameters for selecting narrow frequency bands for processing | ||
| + | * Parameters related to the output of results from f-k processing. | ||
| + | |||
| + | The pre-processing parameters for excluding data from processing follow the same argumentation as the | ||
| + | data selection for other toolboxes like H/V processing. One can apply the so-called [[Geopsy: anti-trigger|anti-trigger]] | ||
| + | approach for removing transient signals from the continuous recordings (i.e. excluding those time chunks from | ||
| + | processing). The [[Geopsy: anti-trigger|anti-trigger]] approach can be applied to raw or filtered data. For the detailed | ||
| + | settings please look into the description of [[Geopsy: anti-trigger|anti-trigger]]. | ||
=== Saving results / contents of output file === | === Saving results / contents of output file === | ||
Revision as of 10:49, 8 March 2010
Contents
Common pre-requisites for array processing - getting ready
Loading signals
View time series
Group signals
Insert / edit station coordinates
F-K Toolbox (conventional f-k)
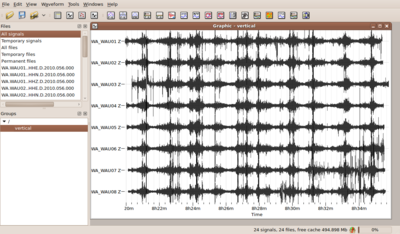
If you have followed all steps above you should have now a set of simultaneously recorded waveforms building a group and containing coordinates for each waveform. You can view this group of waveforms in the data viewer and should get a picture like the one shown to the right.
Now you can open the conventional frequency wavenumber toolbox by pushing the plugin icon ![]() .
.
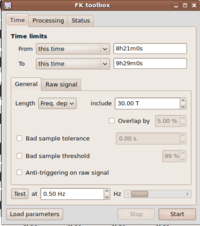
The f-k toolbox should open and is now attached to the signal viewer. No other toolbox will now open with the signals you have loaded to the signal viewer. In order to process the same data set by another tool, you have to open them in a different signal viewer window. Note also, that once you close either the f-k toolbox window or the signal viewer, there is no way to undo this action - you will have to start again by opening a new signal viewer and attaching the f-k toolbox to it. Alternatively you can drag your group directly into the f-k toolbox icon. Geopsy will automatically open a new exclusively attached signal viewer for you.
Let's now have a close look to the individual parameters to be set in the f-k toolbox. There are four main groups of parameters to be considered.
- Pre-processing parameters for excluding data from processing.
- Processing parameters for selecting time windows on the remaining data.
- Processing parameters for selecting narrow frequency bands for processing
- Parameters related to the output of results from f-k processing.
The pre-processing parameters for excluding data from processing follow the same argumentation as the data selection for other toolboxes like H/V processing. One can apply the so-called anti-trigger approach for removing transient signals from the continuous recordings (i.e. excluding those time chunks from processing). The anti-trigger approach can be applied to raw or filtered data. For the detailed settings please look into the description of anti-trigger.
Saving results / contents of output file
Graphical display of f-k results using max2curve
High resolution frequency wavenumber Toolbox (Capon's method)
Saving results / contents of output file
Graphical display of f-k results using max2curve
Modified Spatial Autocorrelation (MSPAC) Toolbox
The Modified Spatial Autocorrelation (MSPAC) was introduced by [1] after pioneer paper of Cite error: Invalid <ref> tag;
invalid names, e.g. too many This method allows computing spatial autocorrelation coefficients for any arbitary array layouts.
Defining rings
Saving results / contents of output file
Graphical display of f-k results using spac2disp
spac2disp
References
- ↑ Bettig B., P.-Y. Bard, F. Sherbaum, J. Riepl, F. Cotton, C. Cornou, D. Hatzfeld, 2001. Analysis of dense array measurements using the modified spatial auto-correlation method (SPAC). Application to Grenoble area., Boletin de Geofisica Teoria e Applicata, 42, 3-4, 281-304.

