Difference between revisions of "Geopsy: H/V and Spectrum Results"
Jump to navigation
Jump to search
(Created page with "The results are presented for the H/V computation of ambient vibration signals recorded at eight sites. Windowing and processing have been performed after adjusting parameter...") |
|||
| Line 6: | Line 6: | ||
* Individual H/V curves for each of the processed station | * Individual H/V curves for each of the processed station | ||
* Summary | * Summary | ||
| + | |||
| + | |||
= Signal and selected windows = | = Signal and selected windows = | ||
| − | [[Image:HV_RESULTS_signal.png|thumb|right|300px|Signal and selected windows]] | + | [[Image:HV_RESULTS_signal.png|thumb|right|300px|Signal and selected windows before processing]] |
| + | After applying the windowing selection criteria, the selected windows appear in green on the signal graphic. | ||
<br style="clear: both"/> | <br style="clear: both"/> | ||
Revision as of 15:07, 10 January 2013
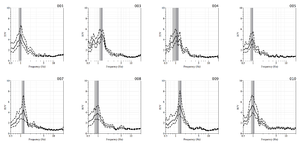
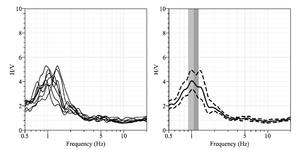
The results are presented for the H/V computation of ambient vibration signals recorded at eight sites.
Windowing and processing have been performed after adjusting parameters in the H/V Toolbox.
As more than one station with 3 components are processed geopsy produce two series of results that appear in two windows:
- Individual H/V curves for each of the processed station
- Summary
Signal and selected windows
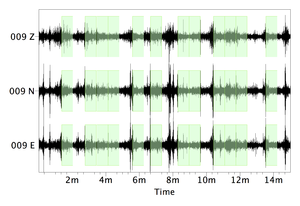
After applying the windowing selection criteria, the selected windows appear in green on the signal graphic.
H/V curves


