Difference between revisions of "Geopsy: H/V and Spectrum Toolboxes: Output Tab"
| Line 20: | Line 20: | ||
The '''lower limit''' should be fixed in two different ways: | The '''lower limit''' should be fixed in two different ways: | ||
* The first possibility is to fix the lower frequency limit equal to the Natural Frequency of your sensor. | * The first possibility is to fix the lower frequency limit equal to the Natural Frequency of your sensor. | ||
| − | * From SESAME output <ref>Guidelines for the implementation of the H/V spectral ratio technique on ambient vibrations measurements, processing and interpretation, [http://SESAME-FP5.obs.ujf-grenoble.fr], 62 pages, April 2005</ref>, the other possibility is to define the lower frequency limit from the window length taking into account the following formula 10/ | + | * From SESAME output <ref>Guidelines for the implementation of the H/V spectral ratio technique on ambient vibrations measurements, processing and interpretation, [http://SESAME-FP5.obs.ujf-grenoble.fr], 62 pages, April 2005</ref>, the other possibility is to define the lower frequency limit from the window length taking into account the following formula <math>\frac{10}{w_l}>f_{seismometer}</math>. |
Revision as of 09:20, 11 March 2010
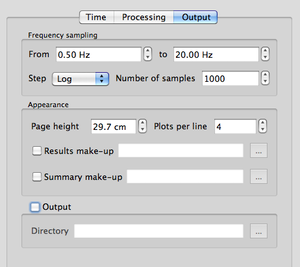
Through this tab, the user is able to fix the parameters to display and save the results.
This tab is divided in three sections
-Frequency sampling section: where the user can fix the parameters on frequency limits and more
-Appearance section section: where the user can fix automatic output graphics appearance parameters
-Output section section: where the user can fix where to save data
Frequency sampling section
In this section, it is possible to fix the upper and lower limits for computing.
The lower limit should be fixed in two different ways:
- The first possibility is to fix the lower frequency limit equal to the Natural Frequency of your sensor.
- From SESAME output [1], the other possibility is to define the lower frequency limit from the window length taking into account the following formula .
But (10/window length) could not be lower than the natural frequency of the seismometer i.e. 25 s. windowing allows you to down until 0.4 Hz i.e. 5 s. seismometer allows you maximum windows length of 50 s.
There are two options to be specified, namely Step and Number of Samples. For the Step parameter, there are two options to be selected from a drop box: Log or Linear. You might have guessed the meaning right away. When choosing Linear then the frequency axis is sampled linearly between the given limits and exactly Number of Samples will be distributed along the axis. Choosing Log accordingly samples the frequency axis logarithmically, i.e. frequency bands are close spaced at lower frequencies
Appearance section
automatic output graphics appearance parameters 


