Difference between revisions of "SciFigs: Graph"
Jump to navigation
Jump to search
| Line 8: | Line 8: | ||
X axis | X axis | ||
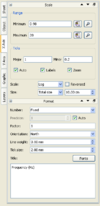
[[Image:SciFigs_Graph_Xaxis.png|right| 100px| X axis tab]] | [[Image:SciFigs_Graph_Xaxis.png|right| 100px| X axis tab]] | ||
| − | The user can set the Minimum and the Maximum Range based on Data Limits [[Image: SciFigs_Graph_Axis_DataLimits.png| | + | The user can set the Minimum and the Maximum Range based on Data Limits [[Image: SciFigs_Graph_Axis_DataLimits.png| 20 px]] |
<br style="clear:both"/> | <br style="clear:both"/> | ||
Y axis | Y axis | ||
Revision as of 15:40, 10 March 2010

A Graph can be any representation of one or a series of groups that represent an X, Y set of data with or withought their Standard Deviation.
By Double Clicking on the window or going to the left right corner of the box - outside the XY plot but inside the Graph, pressing the right button and selecting Properties, the user have the possibility to access and define the properties of the XY plot and the Graph.
From the Properties Window you can define X axis, Yaxis, Graphic and Layers.
X axis

The user can set the Minimum and the Maximum Range based on Data Limits ![]()
Y axis
Graphic
Layers