Difference between revisions of "Warangps"
| Line 17: | Line 17: | ||
<br style="clear: both"/> | <br style="clear: both"/> | ||
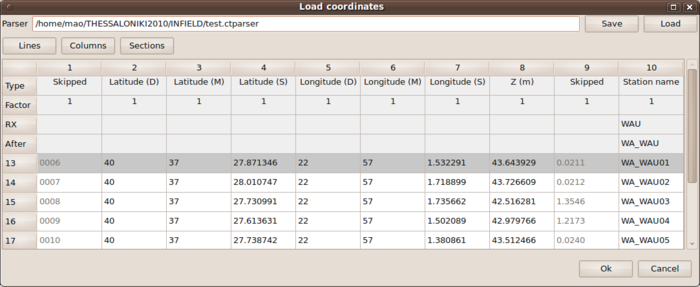
| − | [[Image:WarangpsCoordParser.png|thumb|right| | + | [[Image:WarangpsCoordParser.png|thumb|right|700px|Loading coordinates using a mulit-column parser]] |
| − | After | + | After loading the pre-configured [[Media:TEST.ctparser|parser file]] or after specifying the different column entries by |
| − | yourself for your own | + | yourself for your own coordinate file, you will load the coordinates by confirming with the ''Ok'' button. |
| − | The displays in warangps will change immediately | + | |
| − | and | + | The displays in warangps will change immediately presenting the coordinates in a table (upper left) and on a map (lower left). |
| + | The array response function (ARF) for the corresponding array geometry will be computed in the wavenumber domain and is | ||
| + | displayed in the right drawing area of warangps. Besides the ARF, there are two more useful visualizations | ||
| + | derived from the array response function. Directly below the ARF figure, 1-D cross sections along different | ||
| + | look directions for the wave propagation are plotted (grey lines, spanning all directions in 2 degree steps). | ||
| + | On the lower right of the drawing area, you will finally find a display of 4 distinct wavenumber values as | ||
| + | curves in frequency vs. slowness which provide information on the capabilities of the array geometry in | ||
| + | terms of resolution and expected aliasing features. | ||
== <math>k_{min}</math> == | == <math>k_{min}</math> == | ||
Revision as of 08:03, 11 March 2010
Warangps - Overview
Warangps is a graphical tool for displaying the status and coordinates of gps devices in a distributed sensor network. Among other things (to be described later), warangps can be used to display the array response function for a specific array geometry.
Loading coordinates

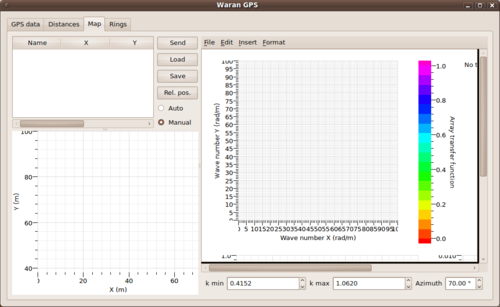
After starting up warangps, you should switch to the Map tab of the graphical user interface and set the radio button from Auto to Manual. Only then you are able to push the Load button to open a free format ASCII coordinate file.
After locating an appropriate file with the file browser, a file parser window will be opened. The flexibel parser is described in detail in the multi-column parser page. Here we provide an example coordinate file and a corresponding parser file.
After loading the pre-configured parser file or after specifying the different column entries by yourself for your own coordinate file, you will load the coordinates by confirming with the Ok button.
The displays in warangps will change immediately presenting the coordinates in a table (upper left) and on a map (lower left). The array response function (ARF) for the corresponding array geometry will be computed in the wavenumber domain and is displayed in the right drawing area of warangps. Besides the ARF, there are two more useful visualizations derived from the array response function. Directly below the ARF figure, 1-D cross sections along different look directions for the wave propagation are plotted (grey lines, spanning all directions in 2 degree steps). On the lower right of the drawing area, you will finally find a display of 4 distinct wavenumber values as curves in frequency vs. slowness which provide information on the capabilities of the array geometry in terms of resolution and expected aliasing features.


