Difference between revisions of "Geopsy: Structure spectrum"
| (3 intermediate revisions by the same user not shown) | |||
| Line 1: | Line 1: | ||
| − | '''Structure spectrum''' is an [[Geopsy: Tools|advanced signal processing tool]] aiming at estimating the Transfer function of a system | + | '''Structure spectrum''' is an [[Geopsy: Tools|advanced signal processing tool]] aiming at estimating the Transfer function of a system by computing the spectral ratio between the input and the output signals. |
| − | |||
==Background== | ==Background== | ||
| − | , | + | Considering a linear system with an input signal (e.g. the ground motion) and an output signal (e.g. the recording at the top of a building), system identification aims at estimating the parameters of the linear system (filter), called Transfer Function. The characteristic values of a linear filter are its poles (peaks) and zeros. In the time domain, the response y(t) of a linear system with a transfer function h(t) to a given input signal x(t) is written using the convolution product: |
| − | + | <math>y(t)=x(t) \otimes h(t)</math> | |
| + | |||
| + | In the frequency domain, this equation turns into a a multiplication product: | ||
| + | |||
| + | <math>Y(f)=X(f)\times H(f)</math> | ||
| + | |||
| + | Among the existing system identification methods, the deconvolution of the output by the input signal implies only signal processing. The simplest deconvolution method is therefore the spectral ratio between output and input signals: | ||
| + | |||
| + | <math>H(f)=\frac{Y(f)}{X(f)}</math> | ||
| + | |||
| + | However, due to zero values in the input spectrum, the estimation of this spectral ratio is not obvious to compute. A solution is to first smooth the spectra before processing. For that purpose, the Konno and Ohmachi (REFERENCE) smoothing is appropriate. It allows to retrieve the frequency peaks of the Transfer function but alters the amplitudes. | ||
| + | |||
| + | For a building, seen as a linear system, the poles of the spectral ratio are its resonance frequencies and are characteristics of its structure (mass and stiffness distribution). | ||
| + | In the case of a building excited by an earthquake, the recorded signal at the top <math>u_t(t)</math> of the building is the sum between the response to the earthquake (relative motion) <math>u_r(t)</math> and the ground motion <math>u_g(t)</math>: | ||
| + | |||
| + | <math>u_t(t)=u_g(t)+u_r(t)=u_g(t)+\ddot{u}_g(t)\otimes h(t)</math> | ||
| + | |||
| + | It is therefore necessary to deconvolve the relative motion <math>u_r(t)=u_t(t)-u_g(t)</math> instead of the total recorded motion <math>u_t(t)</math>. <math>u_r(t)</math> can also be seen as the solution of the homogeneous equation of motion. | ||
| + | |||
| + | In practice, computing the Transfer function instead of the spectrum only is useful to remove a non-white input as an earthquake motion. It can be also useful for ambient vibration recordings if the signal-to-noise ratio is low, for example for a stiff building on a soft soil. In that case the soil response may mask the building response even at the top floor and the spectral ratio allow to isolate the building response. | ||
| + | |||
| + | However, the transfer function is not able to remove the effect of soil-structure interaction (SSI). Indeed, SSI is due to the fact that the foundation of the structure is not perfectly clamped in the ground and causes differential motion between the foundation and the soil (back-radiation of energy from the building to the ground). The soil-structure system is therefore fully coupled and only the whole system can be represented by a linear input-output system, not the structure only. | ||
==Pre-Processing== | ==Pre-Processing== | ||
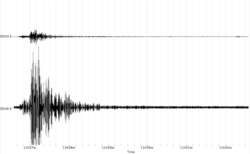
| + | [[Image:EQrec.png|thumb|right|250px|Recordings of an earthquake at the bottom and top of a structure]] | ||
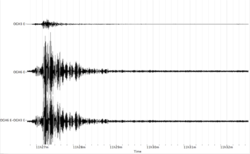
| + | [[Image:EQrecdiff.png|thumb|right|250px|Created signal viewer with the difference top-bottom (relative motion).]] | ||
| + | |||
Before starting the ''Structure spectrum'' toolbox, the signals should be rearranged by pairs. In the pre-processing toolbox (see below), check-boxes allow to discard Z, N or E components, therefore simplifying this procedure. Moreover, in case of odd number of signals, the last one is removed. The toolbox will compute the Transfer function between the first and the second signal, i.e. the spectral ratio of the second over the first signal. In a building, the bottom recording should therefore be placed first and the top recording second. | Before starting the ''Structure spectrum'' toolbox, the signals should be rearranged by pairs. In the pre-processing toolbox (see below), check-boxes allow to discard Z, N or E components, therefore simplifying this procedure. Moreover, in case of odd number of signals, the last one is removed. The toolbox will compute the Transfer function between the first and the second signal, i.e. the spectral ratio of the second over the first signal. In a building, the bottom recording should therefore be placed first and the top recording second. | ||
| Line 13: | Line 36: | ||
*''Excludes components''. 3 check boxes allow to discard Vertical and/or North and/or East components. This is to help the rearrangement of signals. | *''Excludes components''. 3 check boxes allow to discard Vertical and/or North and/or East components. This is to help the rearrangement of signals. | ||
*''Third signal operation''. A third signal is added to each pair of signals that will be used in the deconvolution (see [[#Deconvolution|Deconvolution]]). Two possibilities are offered: | *''Third signal operation''. A third signal is added to each pair of signals that will be used in the deconvolution (see [[#Deconvolution|Deconvolution]]). Two possibilities are offered: | ||
| − | **''Difference'' computes the difference signal | + | **''Difference'' computes the difference signal 2 minus signal 1 for each pair of signals. For bottom and top recordings in a building, this corresponds to the relative motion of the structure (see [[#Background|Background]]) |
**''Average'' computes the average of each pair of signals. It seems to be an obsolete option. | **''Average'' computes the average of each pair of signals. It seems to be an obsolete option. | ||
| − | + | Clicking ''OK'' creates a new [[Geopsy: Signal Viewer|signal viewer]] with the initial signals and the resulting third signal and the processing toolbox appears. | |
==Processing Toolbox== | ==Processing Toolbox== | ||
The processing toolbox is the same used for H/V and Spectrum and is described [[Geopsy:_H/V_and_Spectrum_Toolboxes|there]]. | The processing toolbox is the same used for H/V and Spectrum and is described [[Geopsy:_H/V_and_Spectrum_Toolboxes|there]]. | ||
| + | |||
==Results== | ==Results== | ||
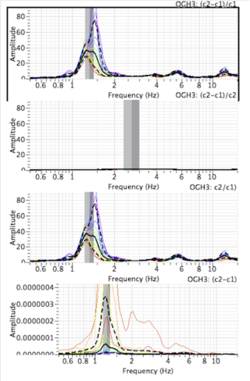
| + | [[Image:EQrec_results.png|thumb|right|250px|Resulting spectral ratios using the Structure spectrum toolbox]] | ||
| + | |||
| + | Starting the processing creates a new [[SciFigs: Graphic sheet|graphic sheet]] with 4 different resulting spectral ratios. Calling c1 the first and c2 the second signal of each pair, the computed spectral ratio are: | ||
| + | *<math>\frac{c2-c1}{c1}</math>. This is the ratio between the relative motion and the input signal, therefore the estimate of the transfer function of the structure. | ||
| + | *<math>\frac{c2-c1}{c2}</math>. This is the ratio between the relative motion and the output signal. It is relatively meaningless. | ||
| + | *<math>\frac{c2}{c1}</math>. This is the ratio between the total motion and the input signal. This is the direct deconvolution between the input and the output that may be useful for other application than in buildings. Even in building, this estimate should be close to the first one. | ||
| + | *<math>c2-c1</math>. This is the spectrum of the relative motion. It allows to show if there is a difference with the transfer function computed above. In case of a white noise input signal (e.g. ambient vibrations), spectra 1 and 4 should have the same shape. | ||
Latest revision as of 15:26, 21 March 2010
Structure spectrum is an advanced signal processing tool aiming at estimating the Transfer function of a system by computing the spectral ratio between the input and the output signals.
Background
Considering a linear system with an input signal (e.g. the ground motion) and an output signal (e.g. the recording at the top of a building), system identification aims at estimating the parameters of the linear system (filter), called Transfer Function. The characteristic values of a linear filter are its poles (peaks) and zeros. In the time domain, the response y(t) of a linear system with a transfer function h(t) to a given input signal x(t) is written using the convolution product:
In the frequency domain, this equation turns into a a multiplication product:
Among the existing system identification methods, the deconvolution of the output by the input signal implies only signal processing. The simplest deconvolution method is therefore the spectral ratio between output and input signals:
However, due to zero values in the input spectrum, the estimation of this spectral ratio is not obvious to compute. A solution is to first smooth the spectra before processing. For that purpose, the Konno and Ohmachi (REFERENCE) smoothing is appropriate. It allows to retrieve the frequency peaks of the Transfer function but alters the amplitudes.
For a building, seen as a linear system, the poles of the spectral ratio are its resonance frequencies and are characteristics of its structure (mass and stiffness distribution). In the case of a building excited by an earthquake, the recorded signal at the top of the building is the sum between the response to the earthquake (relative motion) and the ground motion :
It is therefore necessary to deconvolve the relative motion instead of the total recorded motion . can also be seen as the solution of the homogeneous equation of motion.
In practice, computing the Transfer function instead of the spectrum only is useful to remove a non-white input as an earthquake motion. It can be also useful for ambient vibration recordings if the signal-to-noise ratio is low, for example for a stiff building on a soft soil. In that case the soil response may mask the building response even at the top floor and the spectral ratio allow to isolate the building response.
However, the transfer function is not able to remove the effect of soil-structure interaction (SSI). Indeed, SSI is due to the fact that the foundation of the structure is not perfectly clamped in the ground and causes differential motion between the foundation and the soil (back-radiation of energy from the building to the ground). The soil-structure system is therefore fully coupled and only the whole system can be represented by a linear input-output system, not the structure only.
Pre-Processing
Before starting the Structure spectrum toolbox, the signals should be rearranged by pairs. In the pre-processing toolbox (see below), check-boxes allow to discard Z, N or E components, therefore simplifying this procedure. Moreover, in case of odd number of signals, the last one is removed. The toolbox will compute the Transfer function between the first and the second signal, i.e. the spectral ratio of the second over the first signal. In a building, the bottom recording should therefore be placed first and the top recording second.
When starting the Structure spectrum toolbox using the Menu Tools or using the Toolbar, a pop-up menu allows several pre-processing:
- Excludes components. 3 check boxes allow to discard Vertical and/or North and/or East components. This is to help the rearrangement of signals.
- Third signal operation. A third signal is added to each pair of signals that will be used in the deconvolution (see Deconvolution). Two possibilities are offered:
- Difference computes the difference signal 2 minus signal 1 for each pair of signals. For bottom and top recordings in a building, this corresponds to the relative motion of the structure (see Background)
- Average computes the average of each pair of signals. It seems to be an obsolete option.
Clicking OK creates a new signal viewer with the initial signals and the resulting third signal and the processing toolbox appears.
Processing Toolbox
The processing toolbox is the same used for H/V and Spectrum and is described there.
Results
Starting the processing creates a new graphic sheet with 4 different resulting spectral ratios. Calling c1 the first and c2 the second signal of each pair, the computed spectral ratio are:
- . This is the ratio between the relative motion and the input signal, therefore the estimate of the transfer function of the structure.
- . This is the ratio between the relative motion and the output signal. It is relatively meaningless.
- . This is the ratio between the total motion and the input signal. This is the direct deconvolution between the input and the output that may be useful for other application than in buildings. Even in building, this estimate should be close to the first one.
- . This is the spectrum of the relative motion. It allows to show if there is a difference with the transfer function computed above. In case of a white noise input signal (e.g. ambient vibrations), spectra 1 and 4 should have the same shape.


