Difference between revisions of "Geopsy: Graph Tools"
| (4 intermediate revisions by the same user not shown) | |||
| Line 1: | Line 1: | ||
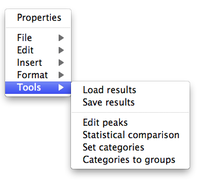
| − | [[Image:HV_RESULTS_HV_tools.png|thumb|right|200px|Graph tools]] | + | [[Image:HV_RESULTS_HV_tools.png|thumb|right|200px|Graph tools items]] |
| − | + | There are six items in '''Graph Tools''': | |
| − | |||
| − | |||
| − | |||
*Load results | *Load results | ||
| Line 10: | Line 7: | ||
*Edit peaks | *Edit peaks | ||
| − | The next three | + | The next three items make more sense to be used when computing several curves. |
*Statistical comparison | *Statistical comparison | ||
| Line 32: | Line 29: | ||
The peak is automatically selected as the point with the maximal amplitude encountered along the curve. It may thus not be the real peak of interest. The '''Edit''' item allows to change the peak location, to add one or several other peaks, or to remove the peak. | The peak is automatically selected as the point with the maximal amplitude encountered along the curve. It may thus not be the real peak of interest. The '''Edit''' item allows to change the peak location, to add one or several other peaks, or to remove the peak. | ||
| − | ''' | + | |
| + | '''MAIN ARTICLE''': [[Geopsy: Edit peaks|'''Edit peaks''']] | ||
<br style="clear: both"/> | <br style="clear: both"/> | ||
| − | |||
= Statistical comparison = | = Statistical comparison = | ||
| Line 48: | Line 45: | ||
<br style="clear: both"/> | <br style="clear: both"/> | ||
= Set categories = | = Set categories = | ||
| + | [[Image:HV_RESULTS_TOOLS_SetCategoriesDefault.png|thumb|right|150px|Only one or no H/V graph has been selected in the selection window]] | ||
| + | '''Set categories''' is used to categorized curves according to their characteristics, such as peak, flat, plateau, low frequency... | ||
| + | <br style="clear: both"/> | ||
| + | |||
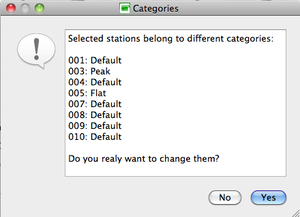
| + | [[Image:HV_RESULTS_TOOLS_CategoriesList.png|thumb|right|300px|List of stations with categories]] | ||
| + | When several curves already categorized are selected to be put under the same category, a warning window appears providing a list of the selected stations and their categories. | ||
| + | <br style="clear: both"/> | ||
| + | |||
= Categories to group = | = Categories to group = | ||
| + | [[Image:HV_RESULTS_TOOLS_CategoriesGroup.png|thumb|right|300px|List of stations with categories]] | ||
| + | '''Categories to group''' is used to save the '''selected curves''' into groups according to the categories used to characterize the curves, including the '''Default''' category. | ||
| + | |||
| + | Each category | ||
| + | |||
| + | If no curves are selected a warning window appears: answer '''Yes''' to save all stations into groups. | ||
Latest revision as of 16:39, 11 March 2013
There are six items in Graph Tools:
- Load results
- Save results
- Edit peaks
The next three items make more sense to be used when computing several curves.
- Statistical comparison
- Set categories
- Categories to group
Contents
Load results
Load a curve which results are stored in a .hv file (Example)
Save results
Save the H/V curve in a .hv file (Example)
Edit peaks
The peak is automatically selected as the point with the maximal amplitude encountered along the curve. It may thus not be the real peak of interest. The Edit item allows to change the peak location, to add one or several other peaks, or to remove the peak.
MAIN ARTICLE: Edit peaks
Statistical comparison
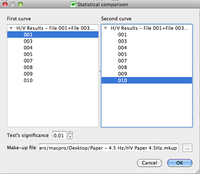
After selecting the Statistical comparison tool, a pop-up windows appears, to select the curves to compare.
There is no need to select individual graphs when using this item . All graphs appear in the selection window, whether or not graphs have been selected.
If no or only one graph has been selected, a warning pop-up window appears and the process is abandoned.
Set categories
Set categories is used to categorized curves according to their characteristics, such as peak, flat, plateau, low frequency...
When several curves already categorized are selected to be put under the same category, a warning window appears providing a list of the selected stations and their categories.
Categories to group
Categories to group is used to save the selected curves into groups according to the categories used to characterize the curves, including the Default category.
Each category
If no curves are selected a warning window appears: answer Yes to save all stations into groups.


