Difference between revisions of "Geopsy: Map Options"
| (One intermediate revision by the same user not shown) | |||
| Line 54: | Line 54: | ||
= Colored bubbles and Interpretation categories = | = Colored bubbles and Interpretation categories = | ||
[[Image:HV_RESULTS_HV_Map_options_Bubbles.png|thumb|right|300px|Colored bubbles and Interpretation categories section]] | [[Image:HV_RESULTS_HV_Map_options_Bubbles.png|thumb|right|300px|Colored bubbles and Interpretation categories section]] | ||
| − | * '''Show colored bubbles''': | + | * '''Show colored bubbles'''. |
| + | <br style="clear: both"/> | ||
| + | When this box is not checked, only the symbols and the label at the receiver locations are shown | ||
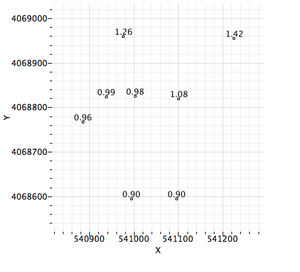
[[Image:HV_RESULTS_HV_map_sans_couleurs.png|thumb|right|300px|Map without colored bubbles]] | [[Image:HV_RESULTS_HV_map_sans_couleurs.png|thumb|right|300px|Map without colored bubbles]] | ||
| − | |||
<br style="clear: both"/> | <br style="clear: both"/> | ||
| Line 62: | Line 63: | ||
| − | |||
| − | |||
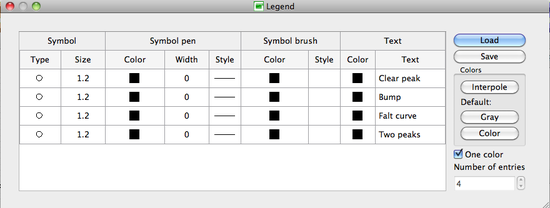
| − | ''' | + | A click on the [[Image:HV_RESULTS_Map_options_LegendButton.png]] button makes the '''Legend''' pop-up window appear. |
| + | [[Image:HV_RESULTS_HV_Map_options_Legend.png|thumb|right|550px|Legend pop-up window]] | ||
| + | <br style="clear: both"/> | ||
| + | The items '''Symbol''', '''Symbol pen''', '''Symbol brush''', and '''Text''' of the '''Legend''' window can be [[SciFigs: _Legend#Legend_box|'''customized''']] | ||
Latest revision as of 18:41, 20 February 2013
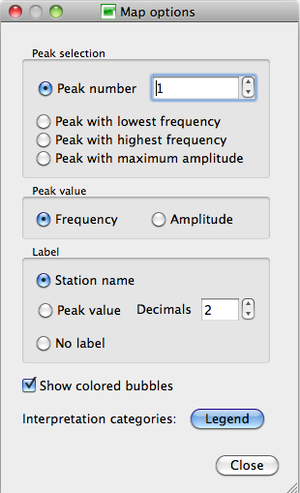
The display parameters may be changed with the pop-up window Map options, divided in four sections:
- Peak Selection
- Peak Value
- Label
- Colored bubbles and legend
Peak Selection
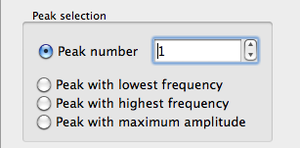
There are four possibilities to select the peak of which the value will be displayed:
- the peak number, according to the peak position along the curve, chosen in the box
- the peak with the lowest frequency
- the peak with the highest frequency
- the peak with the highest amplitude, regardless of its frequency and position in the curve
When all curves present only one peak, and/or no peak, all four options lead to the same display, except a Peak number value greater than 1, in which case no information on the peak values (color nor label) are displayed.
Peak Value
Choose which of the frequency or amplitude value of the selected peak will be used for the map display.
The chosen Peak value controls the use of Color bubbles and of the Peak value in the label section.
Label
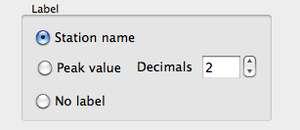
Indicates how the receiver locations are labeled:
- Station name: the name used in geopsy for the receiver.
- Peak value: the frequency or amplitude of the peak that have been chosen in the Peak selection section, with the number of decimals set in the Decimals box.
- No label.
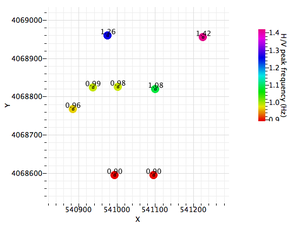
For example, when Frequency in the Peak value section is selected, the peak frequency values are used as label instead of the default receiver name next to the frequency color coded symbol.
Colored bubbles and Interpretation categories
- Show colored bubbles.
When this box is not checked, only the symbols and the label at the receiver locations are shown
- Interpretation categories: customize the display according to the curve categories defined in Graph tools
A click on the ![]() button makes the Legend pop-up window appear.
button makes the Legend pop-up window appear.
The items Symbol, Symbol pen, Symbol brush, and Text of the Legend window can be customized
