Difference between revisions of "Geopsy: H/V and Spectrum Results"
Jump to navigation
Jump to search
| Line 13: | Line 13: | ||
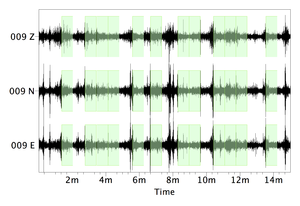
[[Image:HV_RESULTS_signal.png|thumb|right|300px|Signal and selected windows before processing]] | [[Image:HV_RESULTS_signal.png|thumb|right|300px|Signal and selected windows before processing]] | ||
| − | After applying the windowing selection criteria, the selected windows appear in green on the signal | + | After applying the windowing selection criteria, the selected windows appear in green on the signal sheet. |
<br style="clear: both"/> | <br style="clear: both"/> | ||
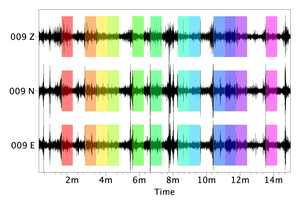
| + | [[Image:HV_RESULTS_signal_2.png|thumb|right|300px|Signal and selected windows before processing]] | ||
| + | |||
| + | After processing, each selected windows appear with its own colour on the signal sheet. | ||
= H/V curves = | = H/V curves = | ||
Revision as of 15:18, 10 January 2013
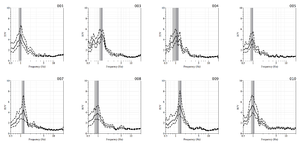
The results are presented for the H/V computation of ambient vibration signals recorded at eight sites.
Windowing and processing have been performed after adjusting parameters in the H/V Toolbox.
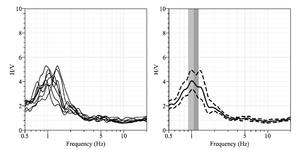
As more than one station with 3 components are processed geopsy produce two series of results that appear in two windows:
- Individual H/V curves for each of the processed station
- Summary
Signal and selected windows
After applying the windowing selection criteria, the selected windows appear in green on the signal sheet.
After processing, each selected windows appear with its own colour on the signal sheet.
H/V curves


