Difference between revisions of "Geopsy: Damping"
| Line 12: | Line 12: | ||
with <math>\omega'=\omega \sqrt{1-\xi^2}</math>, <math>\xi</math> the damping ratio and <math>\omega</math> the angular resonance frequency of the system. The assumption of viscous damping may not be appropriate in all cases but is common in civil engineering and seismology. | with <math>\omega'=\omega \sqrt{1-\xi^2}</math>, <math>\xi</math> the damping ratio and <math>\omega</math> the angular resonance frequency of the system. The assumption of viscous damping may not be appropriate in all cases but is common in civil engineering and seismology. | ||
| − | The Random Decrement technique is based on the assumption that at each time step, the signal is the sum of a random signal and the impulse response function of the study-system. Stacking time windows with the same initial condition | + | The Random Decrement technique is based on the assumption that at each time step, the signal is the sum of a random signal and the impulse response function of the study-system. Stacking many time windows with the same initial condition results in enhancing the impulse response function component with respect to the zero-mean random part. The algorithm selects all the windows of the given length starting with a 0 amplitude and a positive derivative and averages them. |
Then, the Impulse response function is fitted by an exponentially decreasing cosine function (starting at 0) depending on an amplitude <math>\alpha</math>, the resonance frequency <math>f=\frac{\omega}{2\pi}</math> and the damping ratio <math>\xi</math>. | Then, the Impulse response function is fitted by an exponentially decreasing cosine function (starting at 0) depending on an amplitude <math>\alpha</math>, the resonance frequency <math>f=\frac{\omega}{2\pi}</math> and the damping ratio <math>\xi</math>. | ||
Revision as of 14:24, 12 March 2010
Damping is an advanced signal processing toolbox originally aiming at computing the viscous damping ratio of an identified oscillating structure using the Random Decrement technique[1] [2]. It can also be very useful in identifying industrial vibration sources (rotating machines, etc.) that can affect and alter H/V and array analysis results.
Contents
Background
Viscous damping ratio is a parameter representing the energy loss of an oscillating system. The loss can be either internal (material damping) or to another system (radiated damping). The computation of the viscous damping assumes the friction forces (energy loss) are proportional to the velocity of the system. For a single degree-of-freedom system, the solution of the differential equation in time (impulse response function) is then an exponentially decreasing sinus function of the form:
Failed to parse (MathML with SVG or PNG fallback (recommended for modern browsers and accessibility tools): Invalid response ("Math extension cannot connect to Restbase.") from server "https://wikimedia.org/api/rest_v1/":): {\displaystyle h(t)=\alpha e^{-\xi \omega t}sin(\omega't) }
with Failed to parse (MathML with SVG or PNG fallback (recommended for modern browsers and accessibility tools): Invalid response ("Math extension cannot connect to Restbase.") from server "https://wikimedia.org/api/rest_v1/":): {\displaystyle \omega'=\omega \sqrt{1-\xi^2}} , Failed to parse (MathML with SVG or PNG fallback (recommended for modern browsers and accessibility tools): Invalid response ("Math extension cannot connect to Restbase.") from server "https://wikimedia.org/api/rest_v1/":): {\displaystyle \xi} the damping ratio and Failed to parse (MathML with SVG or PNG fallback (recommended for modern browsers and accessibility tools): Invalid response ("Math extension cannot connect to Restbase.") from server "https://wikimedia.org/api/rest_v1/":): {\displaystyle \omega} the angular resonance frequency of the system. The assumption of viscous damping may not be appropriate in all cases but is common in civil engineering and seismology.
The Random Decrement technique is based on the assumption that at each time step, the signal is the sum of a random signal and the impulse response function of the study-system. Stacking many time windows with the same initial condition results in enhancing the impulse response function component with respect to the zero-mean random part. The algorithm selects all the windows of the given length starting with a 0 amplitude and a positive derivative and averages them. Then, the Impulse response function is fitted by an exponentially decreasing cosine function (starting at 0) depending on an amplitude Failed to parse (MathML with SVG or PNG fallback (recommended for modern browsers and accessibility tools): Invalid response ("Math extension cannot connect to Restbase.") from server "https://wikimedia.org/api/rest_v1/":): {\displaystyle \alpha} , the resonance frequency Failed to parse (MathML with SVG or PNG fallback (recommended for modern browsers and accessibility tools): Invalid response ("Math extension cannot connect to Restbase.") from server "https://wikimedia.org/api/rest_v1/":): {\displaystyle f=\frac{\omega}{2\pi}} and the damping ratio Failed to parse (MathML with SVG or PNG fallback (recommended for modern browsers and accessibility tools): Invalid response ("Math extension cannot connect to Restbase.") from server "https://wikimedia.org/api/rest_v1/":): {\displaystyle \xi} .
Practical Use
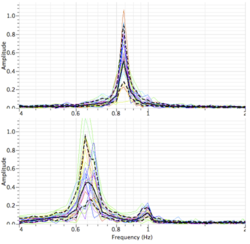
The Damping toolbox is used in Geopsy after detecting peaks in the Power Spectrum or the Structure spectrum. Computing the damping ratio is above all an indication on the origin of the peak. An undamped peak (Failed to parse (MathML with SVG or PNG fallback (recommended for modern browsers and accessibility tools): Invalid response ("Math extension cannot connect to Restbase.") from server "https://wikimedia.org/api/rest_v1/":): {\displaystyle \xi<<1} ) is produced by a self-entertaining source, generally an industrial machine. In an oscillating structure like a building, the damping ratio ranges between 1 and 10%. Slightly lower values are possible for slender structures. Higher damping cannot generally be detected in recordings because of too low energy. For ground ambient vibration recordings, oscillating structures (machines, buildings, trees...) may pollute the signals and lead to false interpretation, e.g. of the H/V spectral ratios.
Damping ratio toolbox
Starting the Damping toolbox found in the Menu Tools or using the Toolbar applies the Random Decrement technique to the signals in the active signal viewer.
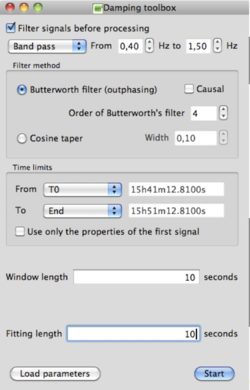
The Damping toolbox is divided into 3 parts: Filter, Time Limits and Parameters of the Random Decrement technique. These parameters are automatically saved and can be restored clicking on Load Parameters.
Filter
Filtering can be activated by checking Filter signal before processing. Applying a narrow band filter is generally necessary in order to select the frequency band of the interesting peak, since other peaks are generally existing in the spectrum. This may strongly affect the signals and is the major drawback of the random decrement technique. The available filtering options are detailed in Filter.
Time Limits
The time limits define the signal range on which the Random Decrement Technique is applied. Options for Time Limits are defined in the corresponding section.
Parameters of the Random Decrement technique
In Geopsy, two parameters can be customized to compute the damping ratio using the Random Decrement technique:
- Window length is size of the stacked windows to compute the random decrement. It should contain at least 10 periods, i.e. Failed to parse (MathML with SVG or PNG fallback (recommended for modern browsers and accessibility tools): Invalid response ("Math extension cannot connect to Restbase.") from server "https://wikimedia.org/api/rest_v1/":): {\displaystyle \frac{10}{f_0}} seconds, with Failed to parse (MathML with SVG or PNG fallback (recommended for modern browsers and accessibility tools): Invalid response ("Math extension cannot connect to Restbase.") from server "https://wikimedia.org/api/rest_v1/":): {\displaystyle f_0} the resonance frequency of interest.
- Fitting length is the time length of the resulting random decrement used for the fitting. It should therefore be lower or equal to the window length. It should first be set to the window length and eventually decreased if the end of the response function is no more described by an exponentially decreasing cosine function.
Several window lengths should always be tested in order to check the robustness of the results.
Results
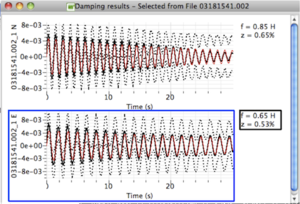
When clicking on start button, a results page appears with one graph per signal processed. Each graph includes 1 layer with 4 lines representing the mean (solid black line) and standard deviation (dashed black line) of the Random Decrement and the fitted exponentially decreasing function (solid red line). Next to each graph, the frequency f (in Hertz) and damping ratio z (in %) of this fitted function are displayed.
References
- ↑ Cole, H. A.: “On-line Failure Detection and Damping Measurements of Aerospace Structures by Random Decrement Signature”, NASA CR-2205, 1973.
- ↑ J. Rodrigues, R. Brincker , Application of Random Decrement Technique in Operational Modal Analysis . Proceedings of the 1st International Operational Modal Analysis Conference (IOMAC), Copenhagen, Denmark, 2005.


