Difference between revisions of "Gpfksimulator"
(→Usage) |
(→Usage) |
||
| (3 intermediate revisions by the same user not shown) | |||
| Line 7: | Line 7: | ||
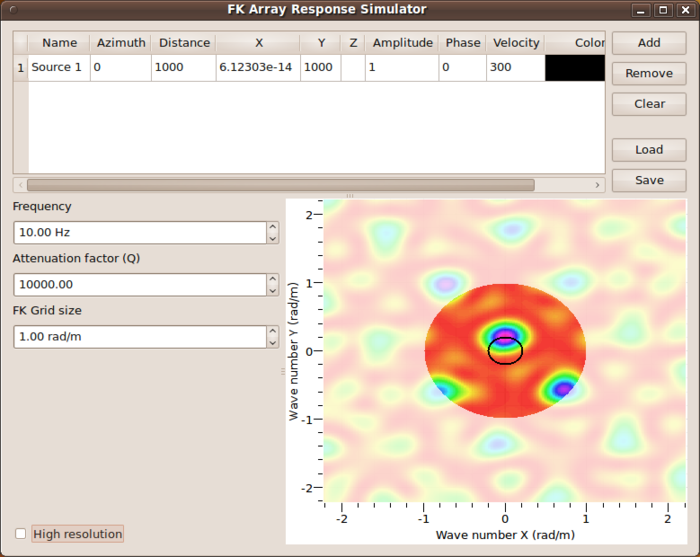
[[Image:GPFKSimulator.png|thumb|left|700px|gpfksimulator after startup]] | [[Image:GPFKSimulator.png|thumb|left|700px|gpfksimulator after startup]] | ||
| − | When starting [[gpfksimulator]] a file | + | When starting [[gpfksimulator]] a file browser will open and you are requested to locate |
a [[SciFigs: Multi-column Parser|multi-column ASCII]] file containing position | a [[SciFigs: Multi-column Parser|multi-column ASCII]] file containing position | ||
coordinates of an array setting. As described in | coordinates of an array setting. As described in | ||
[[Warangps#Loading_coordinates|warangps section on loading coordinates]] a flexible parser | [[Warangps#Loading_coordinates|warangps section on loading coordinates]] a flexible parser | ||
| − | will allow you to adjust to | + | will allow you to adjust to you own ASCII file formats. |
As in [[warangps]], the array response function will be immediately computed and displayed, however, this time not for | As in [[warangps]], the array response function will be immediately computed and displayed, however, this time not for | ||
| − | a | + | a vertically incident plane wave (impinging on the array configuration from below with <math>\vec{k} = 0</math>), but for |
| − | a plane wave with parameters as given in the first table line. | + | a plane wave with parameters as given in the first table line. On default, a harmonic signal propagating at a |
| − | On default, a harmonic signal propagating at a wave speed of 300 m/s at a signal frequency of 1 Hz and a propagation | + | wave speed of 300 m/s at a signal frequency of 1 Hz and a propagation |
| − | direction of <math>0^\circ</math>. | + | direction of <math>0^\circ</math>. Note that a black circle will overlaid to the wavenumber map similar to |
| + | the display in the [[FK#Testing_parameter_settings_and_starting_f-k_processing|wavenumber browser window]] | ||
| + | in [[FK]] and [[HRFK]] toolboxes. | ||
You can edit any entry in the table row to change the | You can edit any entry in the table row to change the | ||
| Line 23: | Line 25: | ||
when changing the azimuth of propagation and distance, the X and Y columns will change accordingly. | when changing the azimuth of propagation and distance, the X and Y columns will change accordingly. | ||
X and Y specify the source location with respect to the array center. Units are degrees for angles and meters for | X and Y specify the source location with respect to the array center. Units are degrees for angles and meters for | ||
| − | distance, m/s for velocities. | + | distance, m/s for velocities. Amplitude and phase of the harmonic function can be changed, but will have no effect |
| + | on the appearance as long as there is only a single signal crossing the array configuration. | ||
| + | The frequency of the harmonic signal can be changed on the left with the '''Frequency''' spin box. | ||
| + | For mimicking plane wave arrivals the distance parameter should be set to at least 3 times the array radius | ||
| + | (see [http://sesame-fp5.obs.ujf-grenoble.fr/delivrables Sesame reports D19.06 and D24.13]. Note that there is an option | ||
| + | to specify damping via the spin box for the '''Attenuation factor (Q)'''. For a single plane wave will | ||
| + | not expect any influence of this parameter except for very large array settings and very low Q-values. | ||
| + | For multiple plane wave arrivals, the Q-value will control the relative amplitude contribution of any plane wave | ||
| + | at the array. To suppress the influence of this setting, use the default value of Q of 10000 (elastic case). | ||
| + | |||
| + | In order to observe better the influence of grating / side lobes and the trade off with selecting a | ||
| + | limit for grid computation ([[FK#Parameters_influencing_the_sampling_of_the_wavenumber_space|grid_size]] | ||
| + | parameter in [[FK]] and [[HRFK]] methods), you can make use of | ||
| + | the last spin box '''FK Grid size'''. It will modify the transparent layer shadowing the parts of the wavenumber map | ||
| + | exceeding this limit. | ||
| + | <br style="clear: both"/> | ||
| + | |||
| + | [[Image:GPFKSimulatorTwoPlanes.png|thumb|left|400px|Two plane wave signals (<math>\phi_1=0^\circ, \phi_2=120^\circ</math> | ||
| + | and <math>v_1=300 m/s, v_2=150 m/s, a_1 = a_2 = 1</math>, same phase).]] | ||
You can now add a second plane wave by pushing the '''Add''' button. A new table row will appear copying the | You can now add a second plane wave by pushing the '''Add''' button. A new table row will appear copying the | ||
properties of the first signal. As above, you may edit any column to change signal properties of this second signal. | properties of the first signal. As above, you may edit any column to change signal properties of this second signal. | ||
| + | play with the relative amplitude and phases between different signals, wave speeeds and propagation directions | ||
| + | and observe the effects of superposition of multiple plane waves on the array response function. For better identification | ||
| + | of the individual plane waves each signal will be attached a circle with the original wave speed expressed in wavenumber. | ||
| + | |||
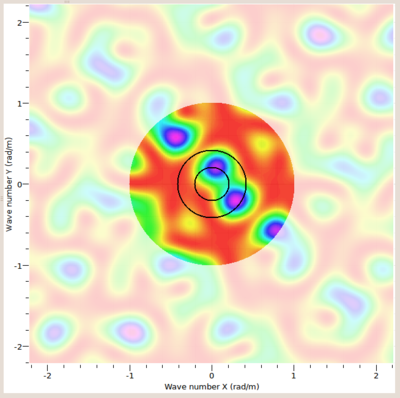
| + | The example to the left shows the supersposition of two plane wave arrivals at 10 Hz with the settings given in the figure caption. | ||
Latest revision as of 09:56, 12 March 2010
Interest
gpfksimulator is intended to be an educational tool. It is a graphical interface displaying the array response function for a superposition of multiple plane waves crossing some given array geometry.
Usage
When starting gpfksimulator a file browser will open and you are requested to locate a multi-column ASCII file containing position coordinates of an array setting. As described in warangps section on loading coordinates a flexible parser will allow you to adjust to you own ASCII file formats.
As in warangps, the array response function will be immediately computed and displayed, however, this time not for a vertically incident plane wave (impinging on the array configuration from below with ), but for a plane wave with parameters as given in the first table line. On default, a harmonic signal propagating at a wave speed of 300 m/s at a signal frequency of 1 Hz and a propagation direction of Failed to parse (MathML with SVG or PNG fallback (recommended for modern browsers and accessibility tools): Invalid response ("Math extension cannot connect to Restbase.") from server "https://wikimedia.org/api/rest_v1/":): {\displaystyle 0^\circ} . Note that a black circle will overlaid to the wavenumber map similar to the display in the wavenumber browser window in FK and HRFK toolboxes.
You can edit any entry in the table row to change the signal propagation properties like wave speed and direction of wave propagation. Note that when changing the azimuth of propagation and distance, the X and Y columns will change accordingly. X and Y specify the source location with respect to the array center. Units are degrees for angles and meters for distance, m/s for velocities. Amplitude and phase of the harmonic function can be changed, but will have no effect on the appearance as long as there is only a single signal crossing the array configuration. The frequency of the harmonic signal can be changed on the left with the Frequency spin box.
For mimicking plane wave arrivals the distance parameter should be set to at least 3 times the array radius (see Sesame reports D19.06 and D24.13. Note that there is an option to specify damping via the spin box for the Attenuation factor (Q). For a single plane wave will not expect any influence of this parameter except for very large array settings and very low Q-values. For multiple plane wave arrivals, the Q-value will control the relative amplitude contribution of any plane wave at the array. To suppress the influence of this setting, use the default value of Q of 10000 (elastic case).
In order to observe better the influence of grating / side lobes and the trade off with selecting a
limit for grid computation (grid_size
parameter in FK and HRFK methods), you can make use of
the last spin box FK Grid size. It will modify the transparent layer shadowing the parts of the wavenumber map
exceeding this limit.

You can now add a second plane wave by pushing the Add button. A new table row will appear copying the properties of the first signal. As above, you may edit any column to change signal properties of this second signal. play with the relative amplitude and phases between different signals, wave speeeds and propagation directions and observe the effects of superposition of multiple plane waves on the array response function. For better identification of the individual plane waves each signal will be attached a circle with the original wave speed expressed in wavenumber.
The example to the left shows the supersposition of two plane wave arrivals at 10 Hz with the settings given in the figure caption.

