Difference between revisions of "SciFigs: Palette"
| (2 intermediate revisions by the same user not shown) | |
(No difference)
| |
Latest revision as of 08:01, 12 March 2010
The Palette is a color scale ranking from a starting to an ending that can follow also a gray scale representation except from the RGB representation of colors.
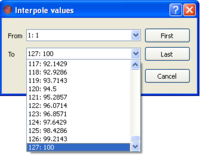
Through the Palette Tab the user can have access into the definition of the Palette Properties. Trough the Palette Box the user can set the number of colors to be used in the ranking, has the ability to Import, Load, or Export, Save, the Palette information from or into a file. This is very useful when one is using command line tools and he wants directly to use a Palette file (.pal). Additionally one can decide to use colors as these is a result of an Interpole
between two colors from the list of colors already used. Also an automatic way to directly use color or gray scale by pressing the ![]() or the
or the ![]() Button in Colors frame. The user can specify the value that correspond to a color index
Button in Colors frame. The user can specify the value that correspond to a color index  and than through the Values frame one can Interpole the Values From any color index To any color index value
using a Linear or a Log Values Interpole. Through the Scale Frame you can specify the Minimum and Maximum values of the Palette either by manually setting this up or by automatically setting up the limits as defined on the Palette Frame above.
Inside the Scale box the user can set from the Range Frame the Minimum and the Maximum Range based on Data Limits ![]() or on current visible maximum (makes sense only if you have zoomed in an area)
or on current visible maximum (makes sense only if you have zoomed in an area) ![]() . In the Ticks Frame you can define the Major and Minor Ticks or set them up automatically, decide if you want to label them (it corresponds to Major Ticks) and also if you will allow to zoom for this Axis. At the end of the Scale box the user can define if he wants the axes to be either Linear, Log and Inversed and also to be Reversed. Further to that the size of either the Total Length of the Graph Size or the Axis Size (in cm) or by defining a Scale (1/x), can be selected.
On the Format Box the user can set the Type of the Number as Fixed size, Scientific and as Time, setting up also a specific Precision or using the Automatic option by checking the Auto Checkbox. Further to that you can set a Factor that can be used to multiple the values of the Axis. Additionally you can set the Orientation of the axis (North is down and any other is to the top). Following the Line Weight for the pen that draw the axis can be set up and additionally the size of the tick marks (Tick size), both in mm. At the end the Fonts of the Title can be set up and the text of the Title itself.
. In the Ticks Frame you can define the Major and Minor Ticks or set them up automatically, decide if you want to label them (it corresponds to Major Ticks) and also if you will allow to zoom for this Axis. At the end of the Scale box the user can define if he wants the axes to be either Linear, Log and Inversed and also to be Reversed. Further to that the size of either the Total Length of the Graph Size or the Axis Size (in cm) or by defining a Scale (1/x), can be selected.
On the Format Box the user can set the Type of the Number as Fixed size, Scientific and as Time, setting up also a specific Precision or using the Automatic option by checking the Auto Checkbox. Further to that you can set a Factor that can be used to multiple the values of the Axis. Additionally you can set the Orientation of the axis (North is down and any other is to the top). Following the Line Weight for the pen that draw the axis can be set up and additionally the size of the tick marks (Tick size), both in mm. At the end the Fonts of the Title can be set up and the text of the Title itself.


