Difference between revisions of "Geopsy: View menu"
| (2 intermediate revisions by one other user not shown) | |||
| Line 8: | Line 8: | ||
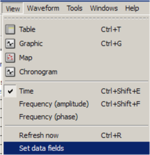
Signals can be viewed in time domain (''Time'', Ctrl+Shift+E) or frequency domain (''Frequency'', spectra, Ctrl+Shift+F). Spectra are complex vector that can be displayed in ''Amplitude'' or ''Phase''. The later is useful only for signals with a few individual discrete frequencies. For continuous spectra, the plot is not easily readable. | Signals can be viewed in time domain (''Time'', Ctrl+Shift+E) or frequency domain (''Frequency'', spectra, Ctrl+Shift+F). Spectra are complex vector that can be displayed in ''Amplitude'' or ''Phase''. The later is useful only for signals with a few individual discrete frequencies. For continuous spectra, the plot is not easily readable. | ||
| + | |||
| + | == Refresh now == | ||
| + | |||
| + | Obsolete. | ||
==Set data fields== | ==Set data fields== | ||
| − | This item is active only for [[Geopsy: Table|tables]] to customize the displayed fields of the current table. In fact, a lot of information contained in signal headers is not displayed by defaults in tables. This tool works exactly in the same way as the [[Geopsy: Preferences#Viewer setting preferences|table preferences]]. | + | This item is active only for [[Geopsy: Table|tables]] to customize the displayed fields of the current table. In fact, a lot of information contained in signal headers is not displayed by defaults in tables. This tool works exactly in the same way as the [[Geopsy: Preferences#Viewer setting preferences|table preferences]].[[Image:SetDataFields2.png|thumb|right|150px|Set data fields option]] |
Button ''Save'' saves the setup of the current table to the global settings affected by [[Geopsy: Preferences#Viewer setting preferences|table preferences]]. The global settings apply to all newly created table. | Button ''Save'' saves the setup of the current table to the global settings affected by [[Geopsy: Preferences#Viewer setting preferences|table preferences]]. The global settings apply to all newly created table. | ||
Latest revision as of 08:00, 11 March 2010
Viewer section
A first section is dedicated to signal viewers. These menu entries creates empty signal viewers that can be filled with drag and drop mechanism.
Fourier Transform
Signals can be viewed in time domain (Time, Ctrl+Shift+E) or frequency domain (Frequency, spectra, Ctrl+Shift+F). Spectra are complex vector that can be displayed in Amplitude or Phase. The later is useful only for signals with a few individual discrete frequencies. For continuous spectra, the plot is not easily readable.
Refresh now
Obsolete.
Set data fields
This item is active only for tables to customize the displayed fields of the current table. In fact, a lot of information contained in signal headers is not displayed by defaults in tables. This tool works exactly in the same way as the table preferences.
Button Save saves the setup of the current table to the global settings affected by table preferences. The global settings apply to all newly created table.
