Difference between revisions of "Effect of very low frequency on H/V"
Jump to navigation
Jump to search
(New page: Here, it is displayed how the H/V can be influenced but a low frequency content in the signal. For that purpose, we merge two different signals: 300px *one a...) |
|||
| Line 5: | Line 5: | ||
*one displaying a low frequency component within [0.1-0.2 Hz] | *one displaying a low frequency component within [0.1-0.2 Hz] | ||
| − | Then the merged signal is computed in H/V | + | Following the Sesame recommandations, to define a 1 Hz frequency for H/V processing, a 10 seconds window should be enough. |
| + | |||
| + | Then the merged signal is computed in a H/V and Spectrum way with 20, 60 and 100 second. | ||
| + | |||
| + | At first, the processing has been done without high pass filter. In this case, the 1 Hz peak appears only with the 100 seconds windowing. | ||
| + | |||
| + | [[Image:No_high_pass_filter.png|300px]] | ||
| + | |||
| + | Later on, another processing has been done with a 0.5 Hz high pass filter. In this case, the 1 Hz peak appears directly with a 20 seconds windowing. | ||
| + | |||
| + | [[Image:High_pass_filter.png|300px]] | ||
Revision as of 17:33, 10 March 2010
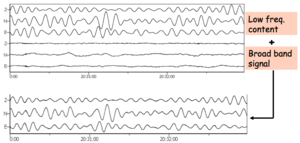
Here, it is displayed how the H/V can be influenced but a low frequency content in the signal. For that purpose, we merge two different signals:
- one at a site having a resonance frequency around 1 Hz
- one displaying a low frequency component within [0.1-0.2 Hz]
Following the Sesame recommandations, to define a 1 Hz frequency for H/V processing, a 10 seconds window should be enough.
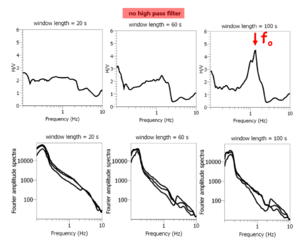
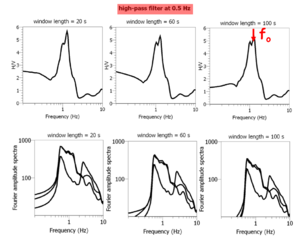
Then the merged signal is computed in a H/V and Spectrum way with 20, 60 and 100 second.
At first, the processing has been done without high pass filter. In this case, the 1 Hz peak appears only with the 100 seconds windowing.
Later on, another processing has been done with a 0.5 Hz high pass filter. In this case, the 1 Hz peak appears directly with a 20 seconds windowing.


