Difference between revisions of "SciFigs: Legend"
Jump to navigation
Jump to search
| Line 5: | Line 5: | ||
== Creating a new legend == | == Creating a new legend == | ||
| − | In a [[SciFigs: Graphic sheet|graphic sheet]] such as [[SciFigs: Figue|figue]], select menu ''Insert/Legend''. Alternatively, use the toolbar icon for legend [[Image:Legend_icon.png| | + | In a [[SciFigs: Graphic sheet|graphic sheet]] such as [[SciFigs: Figue|figue]], select menu ''Insert/Legend''. Alternatively, use the toolbar icon for legend [[Image:Legend_icon.png|20px]] or right-click on a blank part of the graphic sheet and access all menu items through the context menu (useful for Mac users who have no top menu bar when the graphic sheet is embedded in a larger application, e.g. inside geopsy). Open this [[Image::Legend_page.page|page file]] in figue to plot the same legend as in figure. |
== Editing a legend == | == Editing a legend == | ||
Revision as of 13:00, 9 March 2010
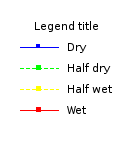
A legend is a graphical object that can be inserted in a graphic sheet. A legend is a description of various line, symbol and text attributes used for plotting curves on a XY plot containing line layers.
Creating a new legend
In a graphic sheet such as figue, select menu Insert/Legend. Alternatively, use the toolbar icon for legend ![]() or right-click on a blank part of the graphic sheet and access all menu items through the context menu (useful for Mac users who have no top menu bar when the graphic sheet is embedded in a larger application, e.g. inside geopsy). Open this [[Image::Legend_page.page|page file]] in figue to plot the same legend as in figure.
or right-click on a blank part of the graphic sheet and access all menu items through the context menu (useful for Mac users who have no top menu bar when the graphic sheet is embedded in a larger application, e.g. inside geopsy). Open this [[Image::Legend_page.page|page file]] in figue to plot the same legend as in figure.
